Analyzing 3rd Party Performance via HTTP Archive + CrUX
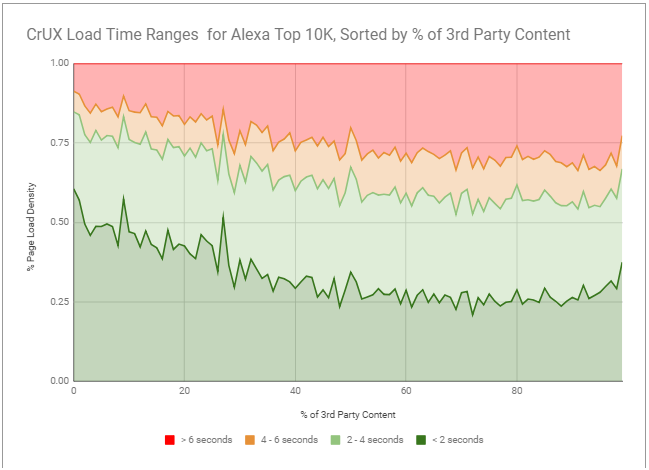
During a discussion about correlating 3rd party content to performance I decided to have some fun combining both the HTTP Archive and Chome User Experience Report data sets to see what we can learn. The results were pretty conclusive that there is a strong correlation between the % of 3rd party content on a site and the load times (measured via the onLoad metric).
This graph illustrates the ranges of load times for the top 10K Alexa sites. I used @igrigorik's regex for 3rd party classification (https://t.co/3nzQhMHDK0) + CrUX onLoad metrics. There is definitely a strong correlation between % of 3rd party content and load times! pic.twitter.com/MSmDieqdKE— Paul Calvano (@paulcalvano) May 15, 2018
Working with both HTTP Archive and CrUX is powerful - because it gives us the ability to analyze real performance data alongside all of the many ways you can slice and dice this data. For example, you can compare RUM data to page weight, CSS complexity, technology stacks via Wappalyzer, specific 3rd parties, frameworks, etc.
Since this has a lot of potential for opening up new avenues to analyzing this data, I thought I’d share how I arrived at the above graph. If anyone has questions/feedback/suggestions feel free to comment below.
Identifying 3rd Party Content
There are quite a few discussion threads here about 3rd party content, but one that I’d like to call to attention is @igrigorik’s post about looking at the distribution of 1st vs 3rd party resources. Ilya wrote a regular expression to attempt to classify a request as 1st or 3rd party content. In standard SQL, that would be:
IF (STRPOS(req_host,REGEXP_EXTRACT(origin, r'([\w-]+)'))>0, 1, 3) AS party
I wanted to take this logic and apply it to analyzing the performance of a large number of sites. Here’s what I did:
Determine the % of Third Party Content for Sites
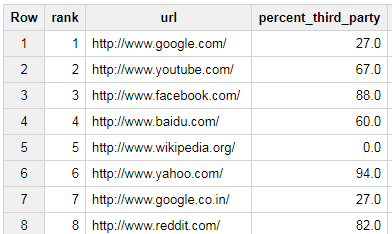
The following query uses Ilya’s regex match to classify the % of third party content. It is joining both the summary pages and summary requests table.
SELECT rank, pages.url,
       FLOOR((SUM(IF(STRPOS(NET.HOST(requests.url),REGEXP_EXTRACT(NET.HOST(pages.url), r'([\w-]+)'))>0, 0, 1)) / COUNT(*))*100) percent_third_party
FROM httparchive.summary_pages.2018_04_15_desktop pages
INNER JOIN httparchive.summary_requests.2018_04_15_desktop requests
ON pages.pageid = requests.pageid
WHERE rank > 0 AND rank < 100000
GROUP BY rank, pages.url
ORDER BY rank ASC
LIMIT 10000
The results from this look like:

Add CrUX Data to the Query
Next I joined the hostname of the page.url and the hostname of the CruX origin. Since CrUX can include both https and http pages, I decided to work with only https pages for this analysis. In the query below, the CASE statement allows us to bucket the load time densities. Then the MAX(IF()) functions in the outer query create a pivot table. To avoid incorrect density aggregations when joining three tables, I first joined CrUX to the pages table. Then I joined the requests table.
SELECT rank, url, percent_third_party,
       MAX(IF(timerange = '< 2s', density,0)) as LessThanTwo,
       MAX(IF(timerange = '2-4s', density,0)) as TwoToFour,
       MAX(IF(timerange = '4-6s', density,0)) as FourTosix,
       MAX(IF(timerange = '> 6s', density,0)) as GreaterThanSix
FROM (

    SELECT rank, crux_pages.url, timerange, FLOOR((SUM(IF(STRPOS(NET.HOST(requests.url),REGEXP_EXTRACT(NET.HOST(crux_pages.url), r'([\w-]+)'))>0, 0, 1)) / COUNT(*))*100) percent_third_party, density
    FROM (
        SELECT rank, pages.url, pageid,
           CASE
              WHEN onload.start < 2000                THEN '< 2s'
              WHEN onload.start BETWEEN 2000 AND 4000 THEN '2-4s'
              WHEN onload.start BETWEEN 4000 AND 6000 THEN '4-6s'
              ELSE                                         '> 6s'
          END AS timerange,
          ROUND(SUM(onload.density),4) AS density
    FROM `chrome-ux-report.all.201804`crux,
      UNNEST(onload.histogram.bin) AS onload
    INNER JOIN httparchive.summary_pages.2018_04_15_desktop pages
    ON NET.HOST(pages.url) = NET.HOST(crux.origin)
    WHERE rank > 0 AND rank < 100000 and origin LIKE 'https://%'
    GROUP BY rank, pages.url, pageid, timerange
    ORDER BY rank ASC
) crux_pages
INNER JOIN httparchive.summary_requests.2018_04_15_desktop requests
ON crux_pages.pageid = requests.pageid
GROUP BY rank, crux_pages.url, timerange, density
ORDER BY rank ASC
)
GROUP BY rank, url, percent_third_party
ORDER BY rank ASC
LIMIT 10000
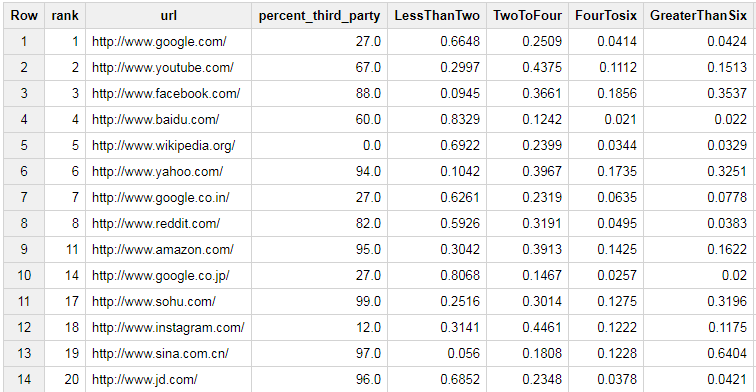
The output of this query looks like this: 
Step 3: Export to Google Sheets and Graph
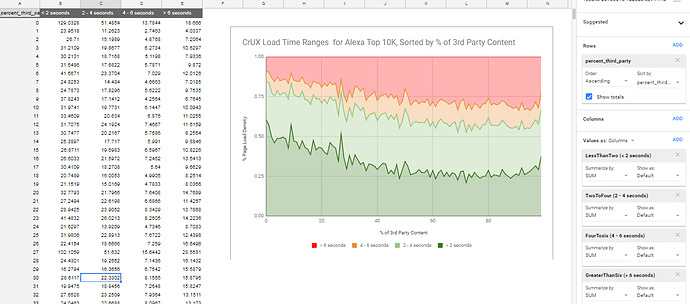
In the Google Sheet, I created a Pivot table that used the percent_third_party column as the rows. Then I aggregate the SUM of each metric to include the full densitiy for each of the 10,000 sites into the results. And finally I chose a Stacked % Area Graph to represent the results -

So What Does this Tell Us?
If you examine the relationship of very fast experiences to slow ones, you’ll notice that the percentage of <2 second response times drops from 50% w/ no 3rd parties down to 25% (with 40% third parties). And as the number of third parties increase, the % of >6 second response times increases as well.

Originally published at https://discuss.httparchive.org/t/analyzing-3rd-party-performance-via-http-archive-crux/1359
