Using Wappalyzer to Analyze CPU Times Across JS Frameworks
Last month WebPageTest added support for Wappalyzer, which makes it super easy to uncover technologies used on websites. And now a month later the data from it is available in the HTTP Archive!
Prior to this integration, if you wanted to search the HTTP Archive for specific technologies then you would need to know exactly what to look for based on HTTP response headers, URL patterns, embedded objects, payloads in JS or CSS, etc. Now it’s simply a matter of parsing JSON out of a HAR file from the pages dataset. This opens up so many new areas for analyzing HTTP Archive data!
How to Extract Wappalyzer Info from HTTP Archive
The latest pages HAR file, httparchive.pages.2018_04_01_desktop, now contains arrays named _detected and _detected_apps (thanks @pmeenan). Here’s an example of what these arrays look like. Note that the categories and apps will vary per site, so you may need to explore a bit to find what you are looking for.
"_detected": {
    "JavaScript Frameworks": "Moment.js,RequireJS,Underscore.js,jQuery,jQuery Migrate,jQuery UI",
    "Ecommerce": "Magento 2",
    "Web Frameworks": "Bootstrap",
    "Web Servers": "Apache",
    "Programming Languages": "PHP"
},
"_detected_apps": {
    "jQuery": "",
    "Bootstrap": "",
    "jQuery UI": "",
    "jQuery Migrate": "",
    "Moment.js": "",
    "Underscore.js": "",
    "Magento": "2",
    "Apache": "",
    "PHP": "",
    "RequireJS": ""
},
Using JSON_EXTRACT(payload,"$._detected.Ecommerce") we can get a list of all ecommerce vendors, or JSON_EXTRACT(payload,"$._detected_apps.Magento") can detect a specific Ecommerce vendor. You can see an example of this in another discussion thread on the HTTP Archive forum, where I identified sites based on URL patterns and cookie names and then later simplified the query using Wappalyzer data.
So let’s look at a simple example of how you can use this, and then expand on what else we can learn by incorporating other data from the HTTP Archive..
What are the most popular JavaScript Frameworks?
To summarize by JavaScript framework previously, you would have had to know exactly which frameworks to look for, the URL patterns for each of them, and then query the HTTP Archive requests table to identify them. Then you would need to join that to the pages table to summarize the results. That’s a fair amount of work.
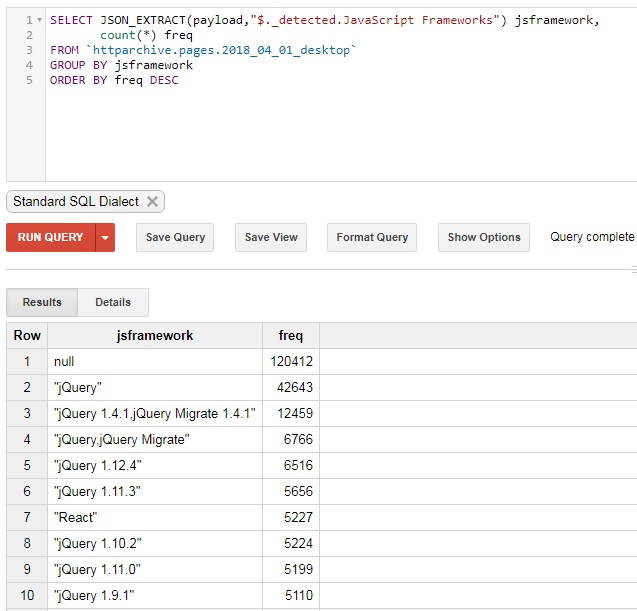
Below is a query that simply extracts the “JavaScript Frameworks” variable from the Wappalyzer results and summarizes by the number of sites using them:
SELECT JSON_EXTRACT(payload,"$._detected.JavaScript Frameworks") jsframework,
       count(*) freq
FROM `httparchive.pages.2018_04_01_desktop`
GROUP BY jsframework
ORDER BY freq DESC
When we run this, we can see that JQuery is by far the most frequently used JS framework. There are also lot of different versions, so some of the other frameworks might be buried under the noise of all the versions numbers.
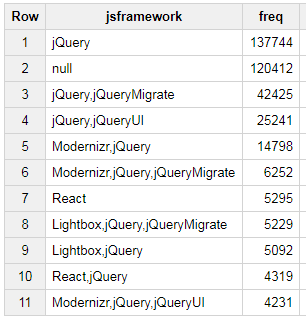
I wanted to summarize this without the version numbers, so I used a simple regular expression to strip them out. In the example below, I removed spaces, periods, and numbers from the list of Frameworks
SELECT  REGEXP_REPLACE(
              JSON_EXTRACT(payload,"$._detected.JavaScript Frameworks"),
                            r"([0-9.\"\s]+)",
                            "") jsframework,
        count(*) freq
FROM `httparchive.pages.2018_04_01_desktop`
GROUP BY jsframework
ORDER BY freq DESC
I was actually really suprised to see that React was so much more commonly used compared to Angular. Also, there appear to be more sites using jQuery than there are sites not using any Framework at all !!!
Analyzing CPU Time Patterns Across JS Frameworks So now that we’ve identified the most popular JavaScript frameworks - let’s try to assess their cost. Last year @addyosmani wrote a fantastic article titled “The Cost of JavaScript”, in which he demonstrated how increasing complexity of JavaScript has a direct impact on the user experience. A noteable quote from his article:
Spending a long time parsing/compiling code can heavily delay how soon a user can interact with your site. The more JavaScript you send, the longer it will take to parse & compile it before your site is interactive.
In the same HAR file that we extracted the Wappalyzer info, we can also see the wall time stats for JavaScript execution times. I decided to take a look at 3 of these times:
- Compile
- Parse (cpuEvaluateScript)
- Execute (cpuFunctionCall)
This query may seem a bit more complex then the earlier example, so here what changed from the previous query - .
- This uses the same regular expression and
JSON_EXTRACT()to extract the JavaScript framework - It uses
JSON_EXTRACT()to extract the CPU times we are interested in, and thenCAST()converts the string value to an integer. - The framework identification is moved to a subquery that extracts all of this information along with the timings. Then we are able to aggregate the results in the outer query.
SELECT jsframework,
       count(*) freq,
       APPROX_QUANTILES(compile, 100)[SAFE_ORDINAL(50)] compile,
       APPROX_QUANTILES(cpuEvaluateScript, 100)[SAFE_ORDINAL(50)] cpuEvaluateScript .
       APPROX_QUANTILES(cpuFunctionCall, 100)[SAFE_ORDINAL(50)] cpuFunctionCall
FROM (
  SELECT  REGEXP_REPLACE(
              JSON_EXTRACT(payload,"$._detected.JavaScript Frameworks"),
              r"([0-9.\"\s]+)",
              "") jsframework,
        CAST(JSON_EXTRACT(payload, "$['_cpu.v8.compile']") as INT64) compile,
        CAST(JSON_EXTRACT(payload, "$['_cpu.FunctionCall']") as INT64) cpuFunctionCall,
        CAST(JSON_EXTRACT(payload, "$['_cpu.EvaluateScript']") as INT64) cpuEvaluateScript
  FROM `httparchive.pages.2018_04_01_desktop`
)
GROUP BY jsframework
ORDER BY freq DESC
And now we can see not only the counts of websites using each Framework - but also the median CPU times.
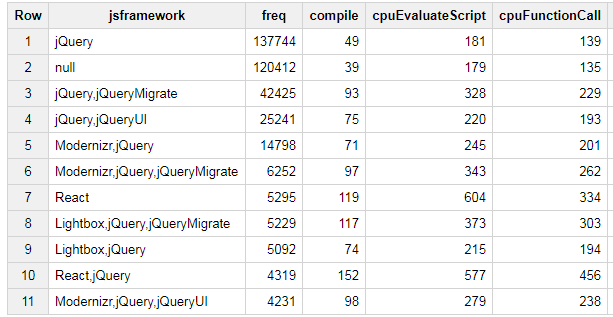
From a quick glance at the table above, the CPU eval costs for React seem to be higher than the others. But to be sure, let’s add a few more percentiles to the query. Below I’ve added the 75th percentile and 95th percentile CPU timings to the query -
SELECT jsframework,
       count(*) freq,
       APPROX_QUANTILES(compile, 100)[SAFE_ORDINAL(50)] compile,
       APPROX_QUANTILES(cpuEvaluateScript, 100)[SAFE_ORDINAL(50)] cpuEvaluateScript,
       APPROX_QUANTILES(cpuFunctionCall, 100)[SAFE_ORDINAL(50)] cpuFunctionCall,
       APPROX_QUANTILES(compile, 100)[SAFE_ORDINAL(75)] compile75,
       APPROX_QUANTILES(cpuEvaluateScript, 100)[SAFE_ORDINAL(75)] cpuEvaluateScript75,
       APPROX_QUANTILES(cpuFunctionCall, 100)[SAFE_ORDINAL(75)] cpuFunctionCall75,
       APPROX_QUANTILES(compile, 100)[SAFE_ORDINAL(95)] compile95,
       APPROX_QUANTILES(cpuEvaluateScript, 100)[SAFE_ORDINAL(95)] cpuEvaluateScript95,
       APPROX_QUANTILES(cpuFunctionCall, 100)[SAFE_ORDINAL(95)] cpuFunctionCall95
FROM (
  SELECT  REGEXP_REPLACE(
              JSON_EXTRACT(payload,"$._detected.JavaScript Frameworks"),
              r"([0-9.\"\s]+)",
              "") jsframework,
        CAST(JSON_EXTRACT(payload, "$['_cpu.v8.compile']") as INT64) compile,
        CAST(JSON_EXTRACT(payload, "$['_cpu.FunctionCall']") as INT64) cpuFunctionCall,
        CAST(JSON_EXTRACT(payload, "$['_cpu.EvaluateScript']") as INT64) cpuEvaluateScript
  FROM `httparchive.pages.2018_04_01_desktop`
)
GROUP BY jsframework
ORDER BY freq DESC
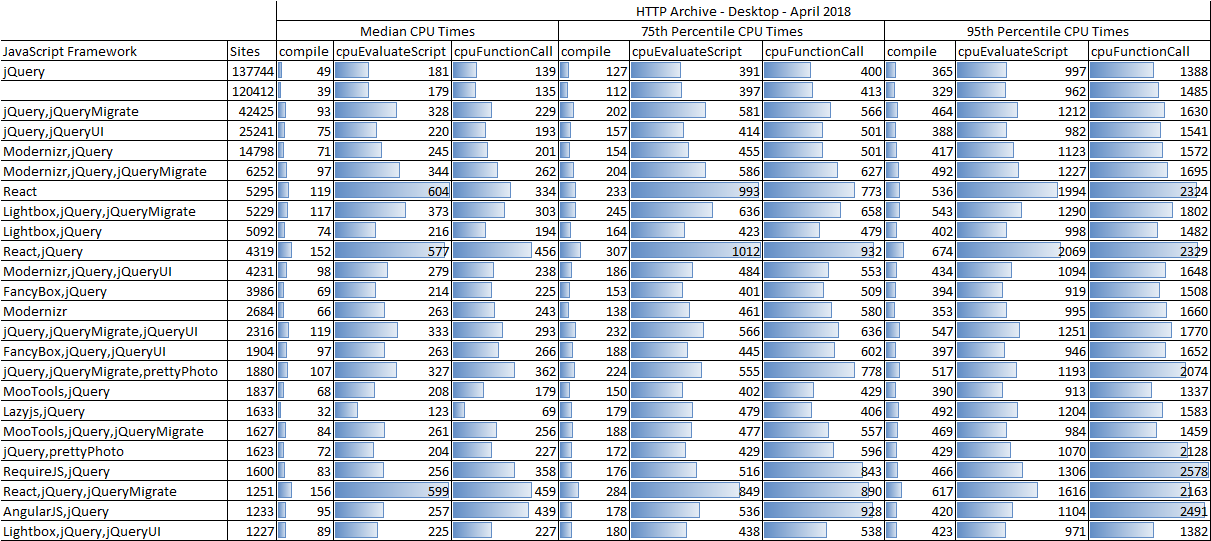
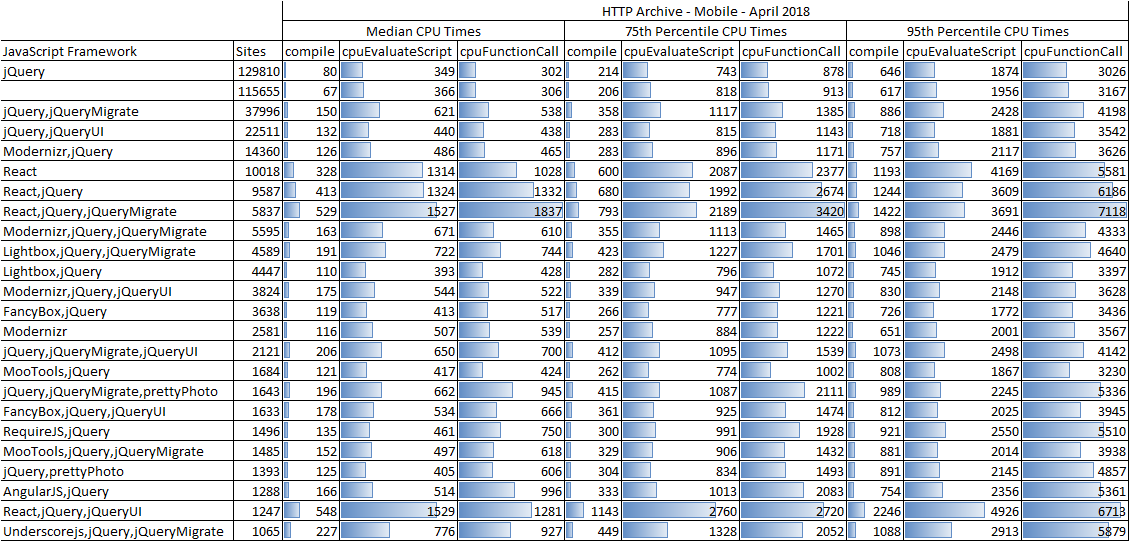
Here’s a break down of the top 25 frameworks detected by Wappalyzer, along with the median, 75th percentile and 95th percentile CPU costs from the pages using them. I’ve used data bars within the table to show how the timings relate to each other.
A few observations from this table:
- The CPU times for JQuery are consistent with the CPU times for sites not using a Framework at all.
- The CPU Function Call times for React and Angular are consistently higher than all the others.
- The CPU Eval times for React applications appear to be consistently higher than the others.
- The CPU Eval times for sites using React and JQuery together do not appear to be much higher than using just React
- The wide range between the median and 75th percentile CPU timings is very interesting, and makes me wonder if examples of how to use these frameworks in more (or less) performant ways are buried in the details (hint: this can also be queried via the HTTP Archive by expanding on this example more )
What About Mobile?
CPU times are even more of an issue with mobile because of the hardware differences. With Android devices we often see a very significant differences in the user experience based on the type of device being used. For example, last year I was able to find a rather significant difference in the onLoad times for mobile devices in Akamai’s mPulse real user measurement data - https://twitter.com/paulcalvano/status/928751141843808256
To query this data for mobile, simply replace desktop with mobile in all the queries above (ie, httparchive.pages.2018_04_01_mobile). When we run the previous query against the mobile dataset, we can see similar stats - although the numbers are much higher (as expected). The HTTP Archive stats for mobile are using a single emulated Android device using the Chrome browser. But based on the device fragmentation map above I would expect the below results to vary greatly by device type as well.
Based on this analysis it definitely seems that the choice of JavaScript framework will have a significant impact on CPU execution times, which will ultimately impact your end user’s experience. However the rather large range of CPU times between the median and 75th percentile give hope that some of these frameworks can be tuned further or that the way that they are being used can be adjusted to limit their impact on the end user.
There’s a lot more that we can dig into with the Wappalyzer data in the HTTP Archive. Feel free to share any insights you find here in the HTTP Archive discussion forums!
Originally published at https://discuss.httparchive.org/t/using-wappalyzer-to-analyze-cpu-times-across-js-frameworks/1336