Mobile Trends during the US Holiday Weekend
Over the past few years we’ve seen a tremendous growth in mobile traffic on the web. Because of this many of the most successful websites have invested in optimizing the experience of users on whatever device they use and however they connect to the internet. With mobile traffic now exceeding desktop, serving a quality mobile experience is more important than ever. During the recent holiday weekend, I was wondering how much retail traffic occurred via mobile or desktop devices. Was there a large shift towards mobile during peak times on Black Friday and Cyber Monday? Did mobile usage spike on specific days, or times of day? And when users are connecting from mobile, are they connecting over cellular networks or WiFi?
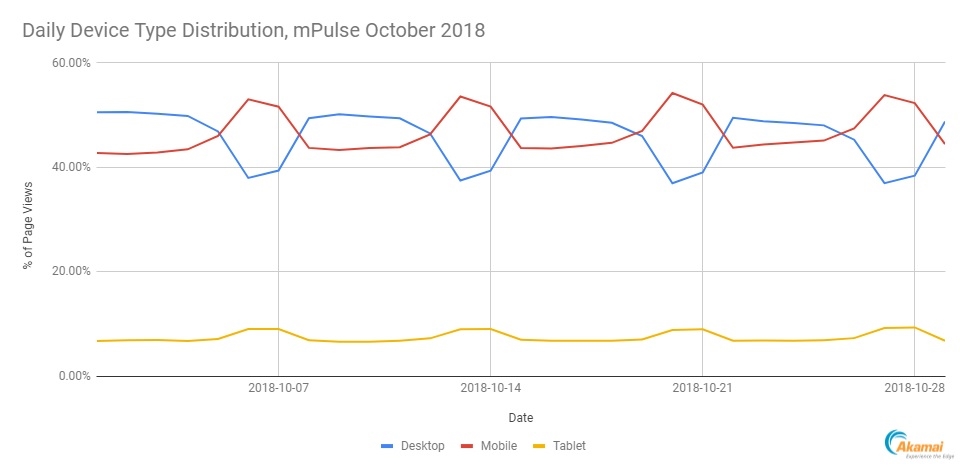
During normal day-to-day traffic we see shifts in device usage on the weekends. For example, in a recent study I learned that percentage of mobile traffic globally is 43% during the week but increases to 53% over the weekend. Tablet usage also increases marginally over the weekend as well. In the graph below you can see this trend for October 2018.
In previous blog posts and talks I’ve shared some insights using data from Akamai mPulse. The data I’m using for this analysis is a subset of overall mPulse traffic – specifically the US traffic of more than 50 retail websites. To avoid skewing stats by some larger sites, I’ve also ensured that none of the sites in this dataset account for more than a few percentage points of the total data set. (Note: non-US retail traffic during the US holiday weekend is a topic I may explore in a future analysis as well.)
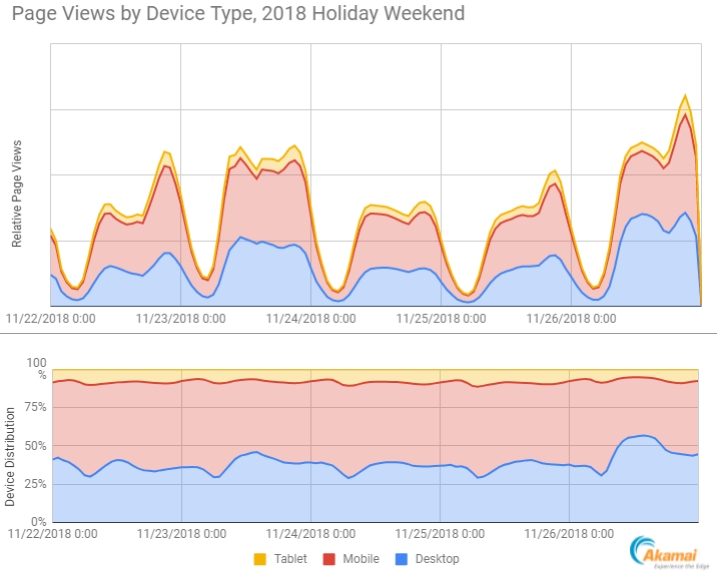
The graph below illustrates the distribution of pages from Desktop, Mobile and Tablet form factors between Thanksgiving and Cyber Monday 2018. There are a few interesting peaks:
- Thanksgiving traffic started to increase around 5pm EST and peaked at 9pm.
- Black Friday traffic was intense from 9am to 10pm EST
- Sunday evening traffic spiked between 8pm and 10pm EST
- Cyber Monday traffic was as high as Black Friday for most of the day, and then bursted 30% higher than Black Friday’s peak during the evening
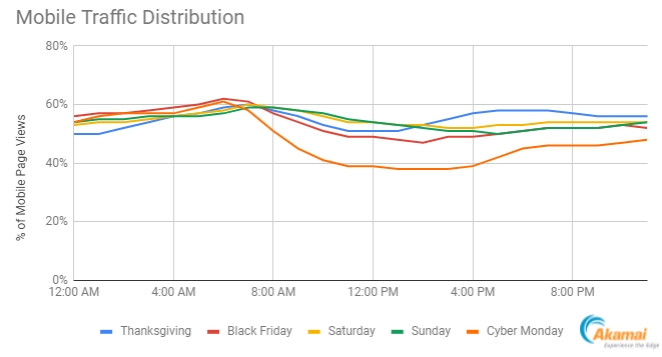
The fluctuations in mobile traffic were particularly interesting to me, so I decided to graph this for each day on a 24 hour axis. The graph below shows the percentage of mobile traffic per hour for each day. There was upwards of 60% mobile traffic during the early mornings, leveling off at 53% during the day. The percentage of mobile traffic during the evening hours of Thanksgiving spiked to 58%. Meanwhile, on Cyber Monday desktop traffic dominated for most of the day. As device usage fluctuates by time of day, it’s important for retailers to focus on providing an optimal experience to all users regardless of how they connect.
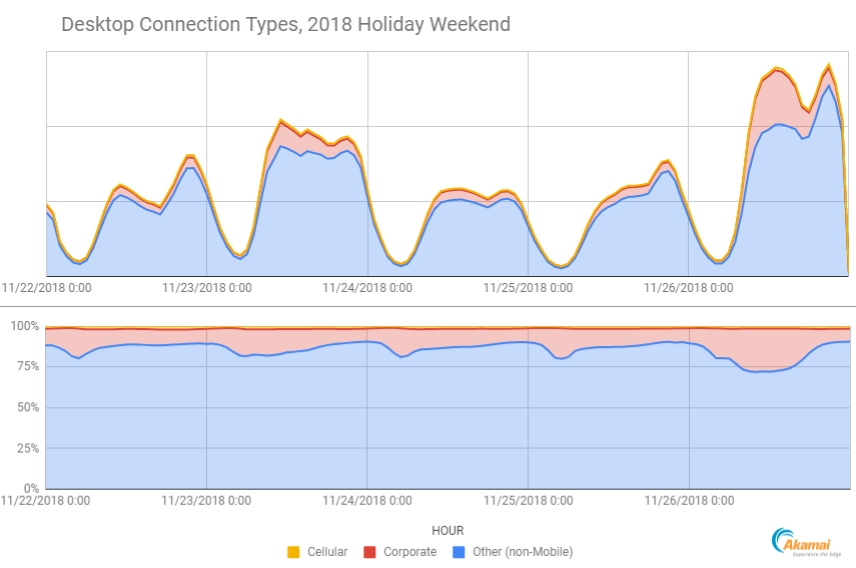
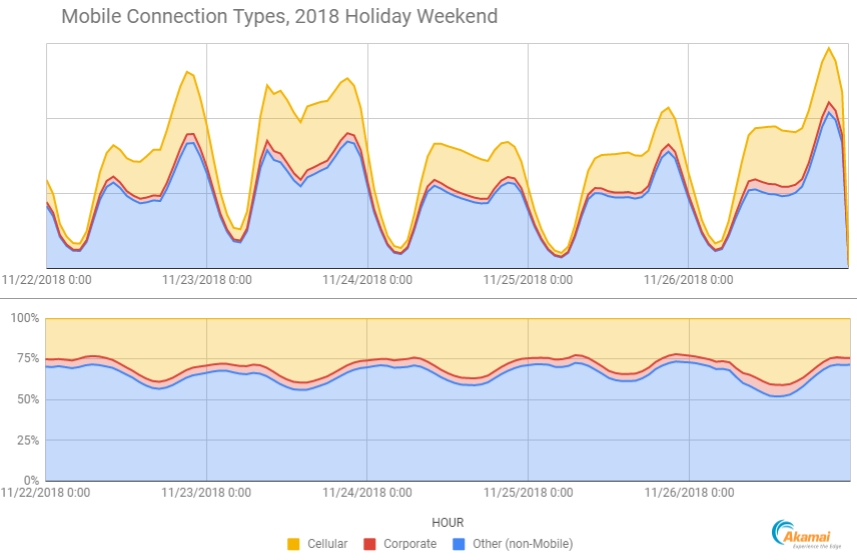
Now that we know what types of devices people are using, let’s explore how they accessed the web. The graph below illustrates the distribution of Desktop pages loaded over Cellular, Corporate and other Non-Mobile networks. The percentage of desktop traffic from corporate networks increased significantly during Cyber Monday and to a smaller extent on Black Friday. This indicates that a fair amount of online shopping was done by people while they were at work. We typically see spikes like this in other industries (such as streaming events), especially when major events are occuring during business hours.
When we look at the same data for Mobile devices, we can see an interesting pattern in connectivity. During each day mobile networks accounted for 40% of mobile traffic between the hours of 12pm and 2pm ET.
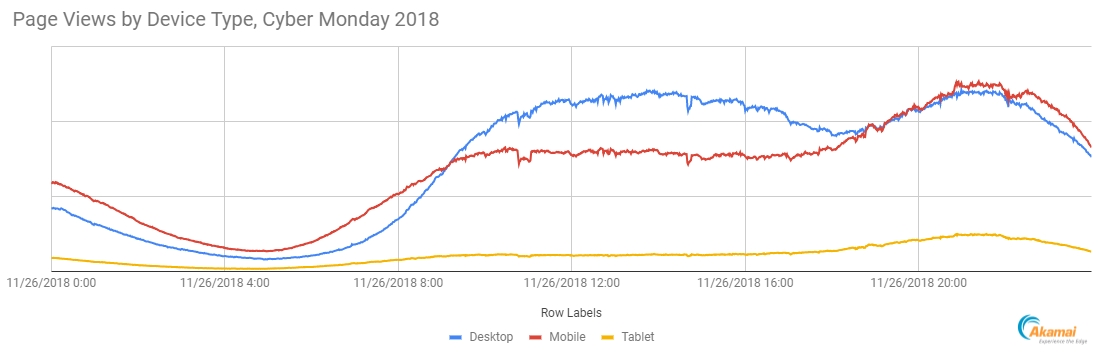
The Cyber Monday traffic patterns were quite interesting, so I decided to look at them on a per minute level. The graph below shows the relative page views for Desktop, Mobile and Tablet traffic. As we saw earlier, Desktop traffic was strongest during the Cyber Monday business day and then started to decline after 5pm EST as the US east coast business day ended. Mobile traffic quickly took its place. In the evening we saw an increase from both Desktop and Mobile traffic, which resulted in the impressive Cyber Monday evening peak. The periodic drops in traffic are likely due to the struggles that some retailers faced.
Many of these stats are similar to what I’ve seen in previous years, but this is the first time we’re able to see an aggregate view of the holiday traffic patterns like this. I’m interested to see how this changes next year.
One important thing to note: when looking at traffic for specific sites, some of the bursts were much more intense than what we see in aggregate. For example, one retailer I worked with had a timed event on Saturday evening, which was one of the lowest traffic days of the weekend. However this retailer managed to double their traffic within 4 minutes. I was particularly impressed with that retailer, because their response times also improved during this time – likely as a result of excellent holiday preparations!
Based on these stats, the 2018 Holiday shopping season seems off to a great start, and we’re seeing some impressive amounts of traffic – both per site and in aggregate across the retail industry. As with most years, mobile traffic continues to grow and spikes during certain times. However just as important as what devices are accessing your sites, the way that they are connecting matter greatly. Mobile traffic is mostly split between Cellular and WiFi, but that distribution varies based on both the time of day as well as the day of the week. In general we are seeing spikes in utilizations for both all form factors, which highlights the importance of ensuring that you can deliver optimal experiences to each device and regardless of how a user is connecting to your site.