Growth of the Web in 2020
For the past 10 years, the HTTP Archive has tracked the evolution of the web by archiving the technical details of desktop and mobile homepages. During its early years, the Alexa top million dataset (which was publicly available until 2017) was used to source the list of URLs included in the archive and the number of sites tracked increased from 16K to almost 500K as testing capacity increased. To keep the archive current and include new sites, towards the end of 2018 we started using the Chrome User Experience Report as a source of the URLs to track.
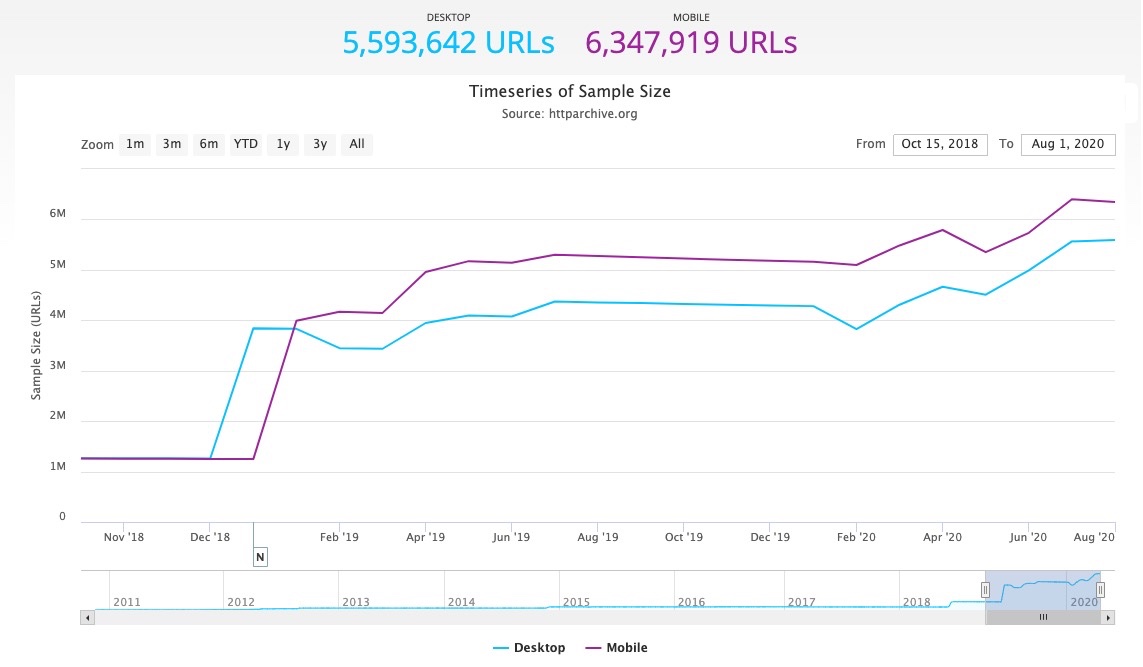
Throughout 2019 the size of the HTTP Archive dataset was mostly constant. However, the sample size has grown quite a bit in 2020 as you can see in the graph below! Additionally, if we combine both desktop and mobile URLs, there was a recent peak of 7.5 million sites!
How are sites Included in the Chrome User Experience Report
The Chrome User Experience Report (CrUX) is sourced from performance data collected from real Chrome users that have opted into syncing their browser history and sharing anonymized usage statistics reporting.It’s essentially real user measurement (RUM) data for Chrome users.
You can read more about CrUX on Google’s Developer website, as well as this informative blog post from Rick Viscomi. I’ve also written about it previously here.
While Google doesn’t publish a definitive list on what it takes to be included in the Chrome User Experience Report dataset, they have indicated that:
- Origins are automatically curated based on real-user Chrome usage
- Websites must meet a traffic threshold to be included.
- Websites must be publicly accessible
Essentially, a website’s inclusion in the Chrome User Experience Report indicates that they’ve reached a certain threshold of activity. According to the CrUX changelog, there have been no changes in the methodology. So it can be inferred that analyzing the number of websites included in this dataset should provide some interesting insights into the month on month growth of the number of websites being visited by real users.
Note: The Chrome User Experience Report does not contain traffic details, and as such this analysis should not be interpreted as growth of traffic on the internet. This analysis is specifically about the growth in the number of websites that people are visiting.
Global Growth of Origins Accessed in 2020
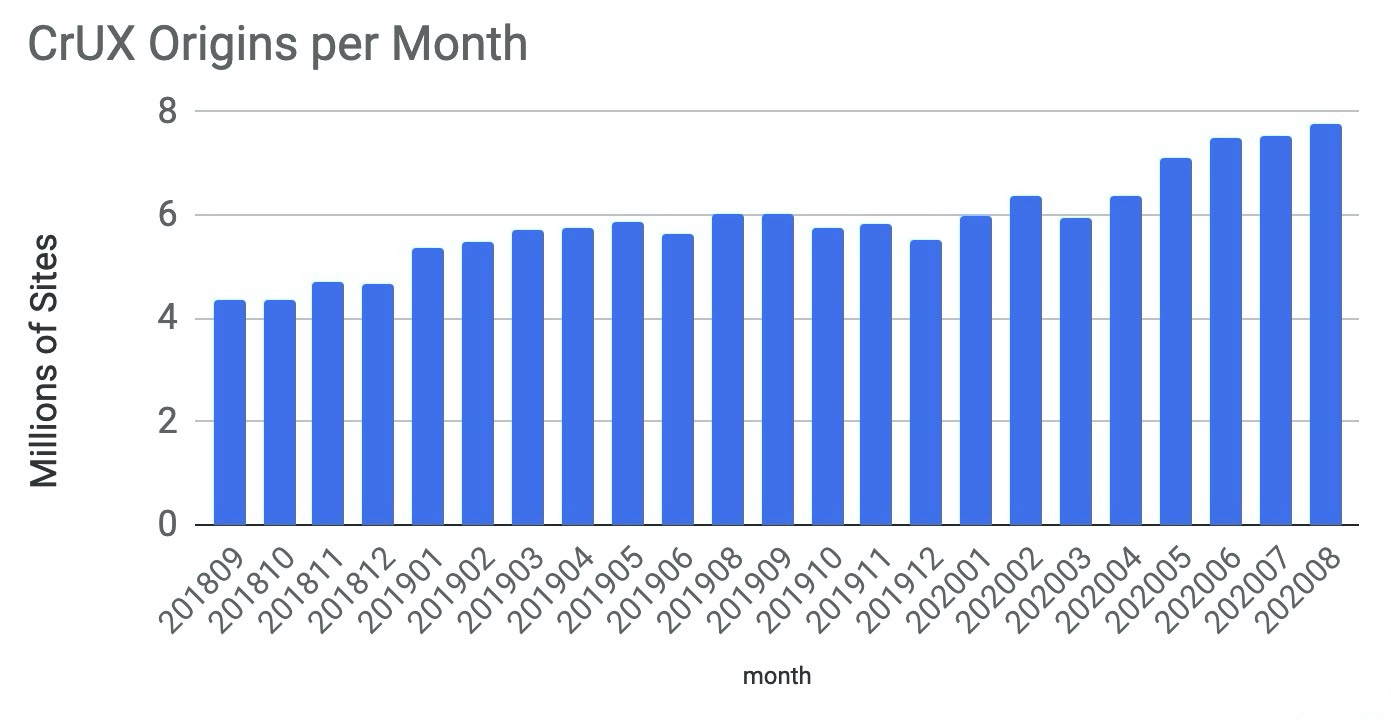
The graph below illustrates the total number of websites that the Chrome User Experience reported across all form factors during the previous 12 months. There are a few interesting observations we can make:
- In both 2019 and 2020 there were increases in the number of websites at the start of the year.
- There was a linear increase in the number of websites through the first half of 2020.
- The drop in March and April 2020 is interesting, since that coincides with the start of the global COVID-19 pandemic.
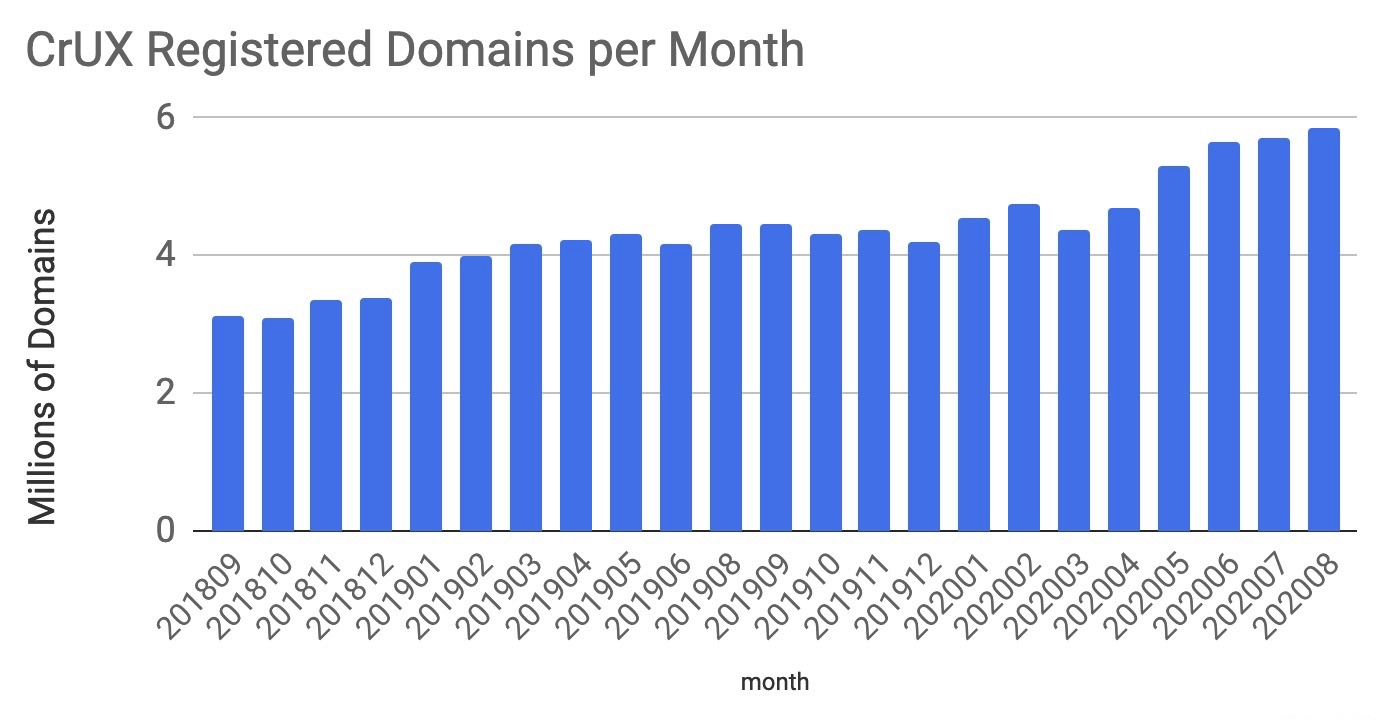
There is a similar pattern with the total number of registered domains. This indicates that much of the growth is new domains and not necessarily subdomains of existing domains.
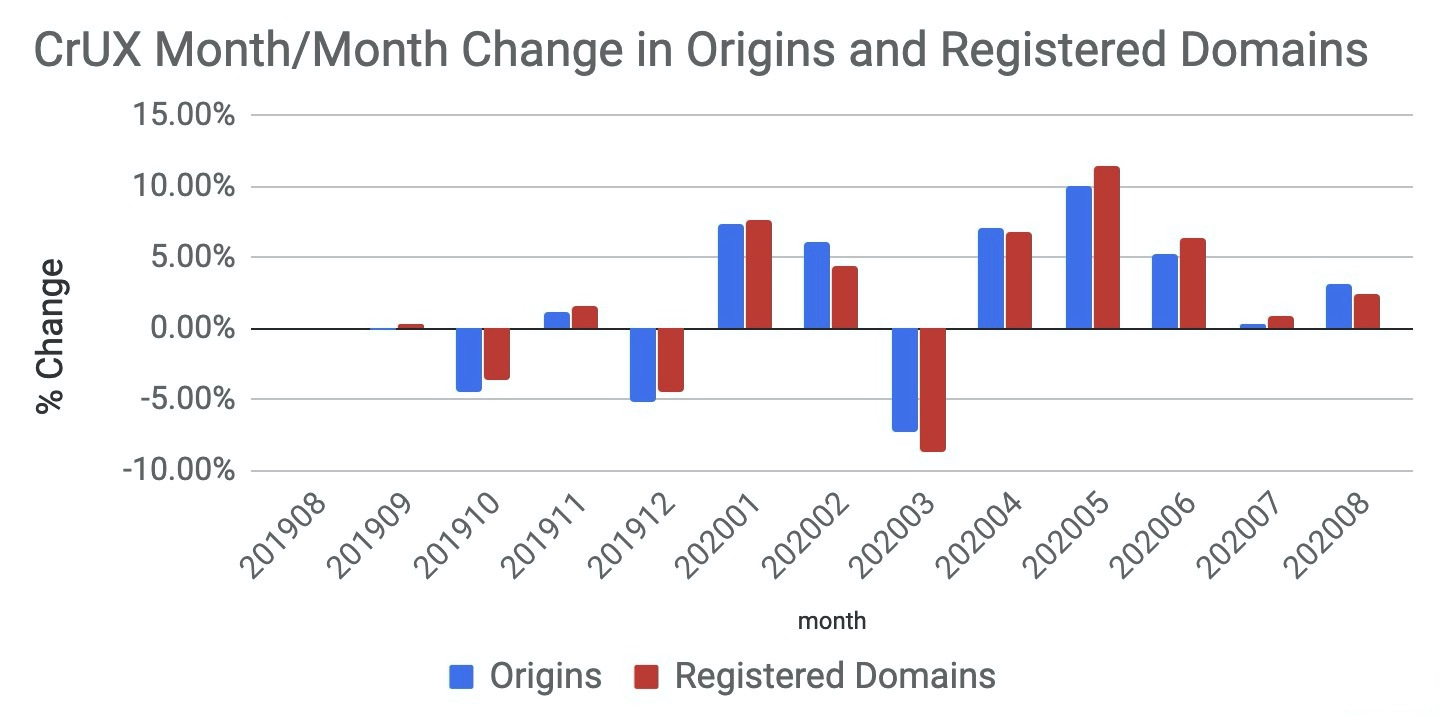
When we look at the month over month rate of change, you can see that the max change in 2019 was +/- 5%. The number of sites tends to fluctuate month to month. For example, between August and December 2019 there was an 8.6% decrease in sites. However at the start of 2020 there was a 7.5% increase.
When comparing the number origins between December 2019 and August 2020, the total number of origins increased by 28.9% this year alone! That’s huge!
Mobile vs Desktop Growth
Looking at this by device type, we can see that there are consistently more mobile websites compared to desktop websites. And over the past year the fluctuations between them have been fairly consistent. The one exception is between May 2020 and June 2020, where desktop increased by 0.7% and mobile increased by 6.2%.
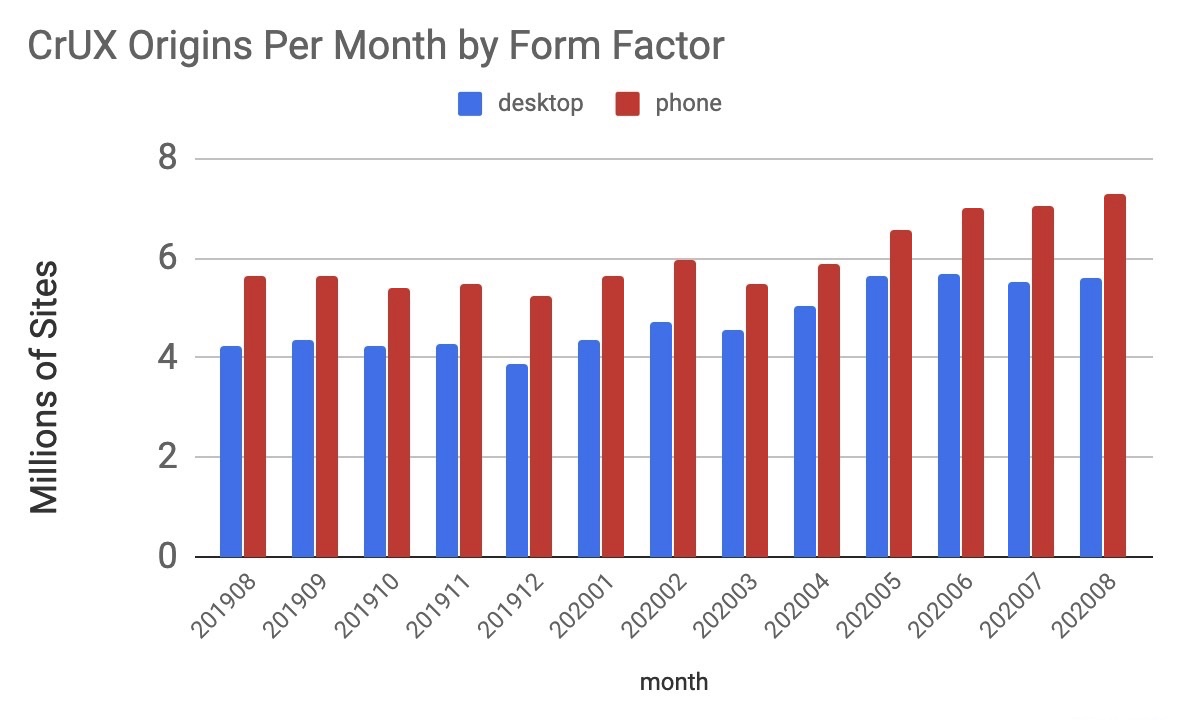
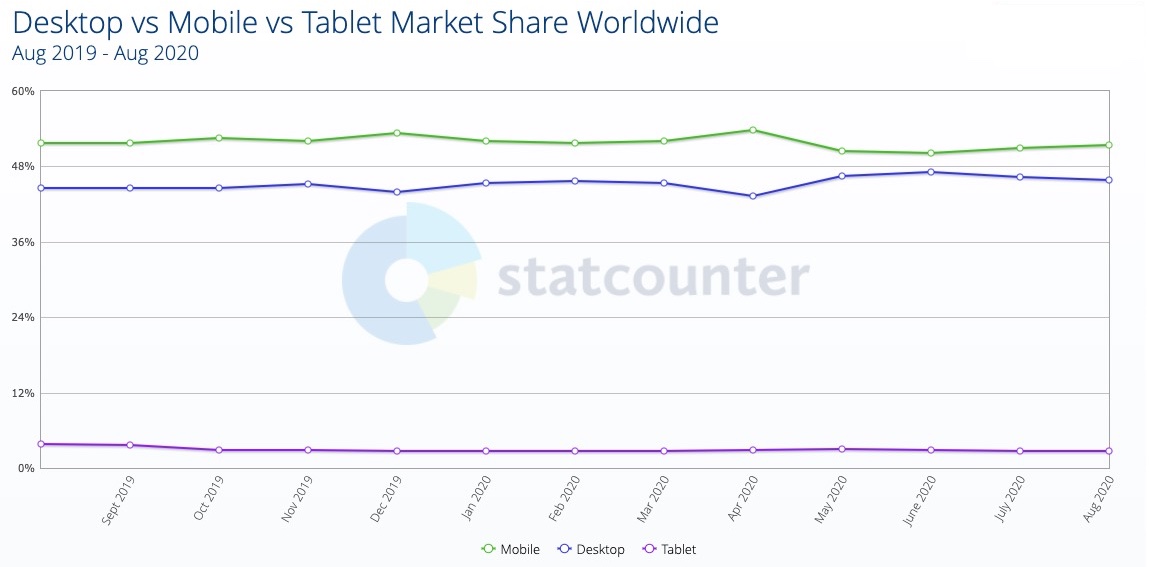
Overall, there are 22.9% more mobile websites in the CrUX dataset compared to desktop. We know from sources like statcounter that mobile usage has grown significantly over the years, and consistently surpasses desktop. But why are mobile users navigating to so many more websites compared to desktop users?
Is there something about the mobile experience (such as social media links, email marketing, etc) that increases the change a user may navigate to an unfamiliar website?
Or could it be growth in regions where mobile is more dominant?
How Has this Varied by Region?
At the start of 2020, most regions of the world saw an increase in the domain of sites. The exception to this was western Asia. The regions that had the most substantial increase at the start of the year were Northern Europe, North America and South America.
Between May and June there was another large uptick in the number of sites. This appeared to be mostly South-East Asian and Western European countries
The tables below detail the number of sites included in the CrUX dataset during December 2019 as well as January, May and June 2020. This first table contains the top 10 regions, most of which saw an increase of 15% to 25% during the previous six months!
Number of Sites Included in CrUX dataset| Sub Region | Dec 2019 | Jan 2020 | May 2020 | June 2020 | August 2020 | | |||||
|---|---|---|---|---|---|---|---|---|---|---|---|
| Northern America | 1,257,159 | 1,406,284 | 1,676,120 | 1,681,454 | 1,730,260 | ||||||
| Western Europe | 713,202 | 768,644 | 874,164 | 908,560 | 943,891 | ||||||
| Eastern Europe | 640,145 | 694,632 | 821,024 | 913,037 | 926,202 | ||||||
| Eastern Asia | 720,926 | 740,767 | 871,854 | 882,322 | 901,008 | ||||||
| South America | 486,894 | 540,685 | 668,604 | 726,410 | 784,854 | ||||||
| Southern Europe | 506,054 | 541,526 | 661,416 | 710,543 | 724,323 | ||||||
| Northern Europe | 453,591 | 516,527 | 601,459 | 638,744 | 661,790 | ||||||
| South-Eastern Asia | 473,962 | 485,143 | 524,249 | 584,214 | 629,815 | ||||||
| Southern Asia | 403,325 | 419,118 | 441,328 | 462,282 | 500,600 | ||||||
| Western Asia | 274,339 | 273,610 | 327,425 | 351,186 | 362,340 | ||||||
Percent Change of Sites Included in CrUX dataset| Sub Region | Dec 2019 - Jan 2020 | May - Jun 2020 | Jun - Aug 2020 | Dec - Aug 2020 | | |||||
|---|---|---|---|---|---|---|---|---|---|---|
| Northern America | 10.60% | 0.32% | 2.82% | 27.34% | ||||||
| Western Europe | 7.21% | 3.79% | 3.74% | 24.44% | ||||||
| Eastern Europe | 7.84% | 10.08% | 1.42% | 30.88% | ||||||
| Eastern Asia | 2.68% | 1.19% | 2.07% | 19.99% | ||||||
| South America | 9.95% | 7.96% | 7.45% | 37.96% | ||||||
| Southern Europe | 6.55% | 6.91% | 1.90% | 30.13% | ||||||
| Northern Europe | 12.18% | 5.84% | 3.48% | 31.46% | ||||||
| South-Eastern Asia | 2.30% | 10.26% | 7.24% | 24.75% | ||||||
| Southern Asia | 3.77% | 4.53% | 7.65% | 19.43% | ||||||
| Western Asia | -0.27% | 6.77% | 3.08% | 24.29% | ||||||
Looking at the next 10 in the list, we can see significant growth in Central America, Australia as well as West, Southern and South Africa. Overall the regions with the most growth during the 7 month period was Australia and New Zealand, South America, and Central America.
Number of Sites Included in CrUX dataset| Sub Region | Dec 2019 | Jan 2020 | May 2020 | June 2020 | August 2020 | | |||||
|---|---|---|---|---|---|---|---|---|---|---|---|
| Central America | 155,057 | 179,295 | 236,255 | 242,132 | 257,043 | ||||||
| Australia and New Zealand | 124,763 | 141,523 | 194,212 | 196,841 | 214,757 | ||||||
| Northern Africa | 68,754 | 69,497 | 83,312 | 88,672 | 88,606 | ||||||
| Southern Africa | 50,618 | 59,139 | 64,978 | 66,392 | 70,218 | ||||||
| Central Asia | 45,932 | 49,192 | 57,098 | 57,508 | 62,112 | ||||||
| Western Africa | 44,692 | 49,868 | 47,834 | 51,257 | 50,853 | ||||||
| Caribbean | 33,840 | 37,445 | 44,090 | 45,910 | 45,395 | ||||||
| Eastern Africa | 31,010 | 34,822 | 36,073 | 37,388 | 38,609 | ||||||
| Middle Africa | 8,873 | 9,149 | 9,121 | 10,057 | 10,032 | ||||||
| Melanesia | 2,733 | 2,991 | 2,580 | 2,779 | 2,818 | ||||||
Percent Change of Sites Included in CrUX dataset| Sub Region | Dec 2019 - Jan 2020 | May - Jun 2020 | Jun - Aug 2020 | Dec - Aug 2020 | | |||||
|---|---|---|---|---|---|---|---|---|---|---|
| Central America | 13.52% | 2.43% | 5.80% | 39.68% | ||||||
| Australia and New Zealand | 11.84% | 1.34% | 8.34% | 41.91% | ||||||
| Northern Africa | 1.07% | 6.04% | -0.07% | 22.40% | ||||||
| Southern Africa | 14.41% | 2.13% | 5.45% | 27.91% | ||||||
| Central Asia | 6.63% | 0.71% | 7.41% | 26.05% | ||||||
| Western Africa | 10.38% | 6.68% | -0.79% | 12.12% | ||||||
| Caribbean | 9.63% | 3.96% | -1.13% | 25.45% | ||||||
| Eastern Africa | 10.95% | 3.52% | 3.16% | 19.68% | ||||||
| Middle Africa | 3.02% | 9.31% | -0.25% | 11.55% | ||||||
| Melanesia | 8.63% | 7.16% | 1.38% | 3.02% | ||||||
Many of the regions that had an increase in sites visited (based on CrUX data), also have a high percentage of mobile visitors compared to the global population (based on statcounter). So while it’s difficult to say for certain, it’s entirely possible that location is a large factor in the gap between Desktop and Mobile.
Analyzing by Top Level Domain
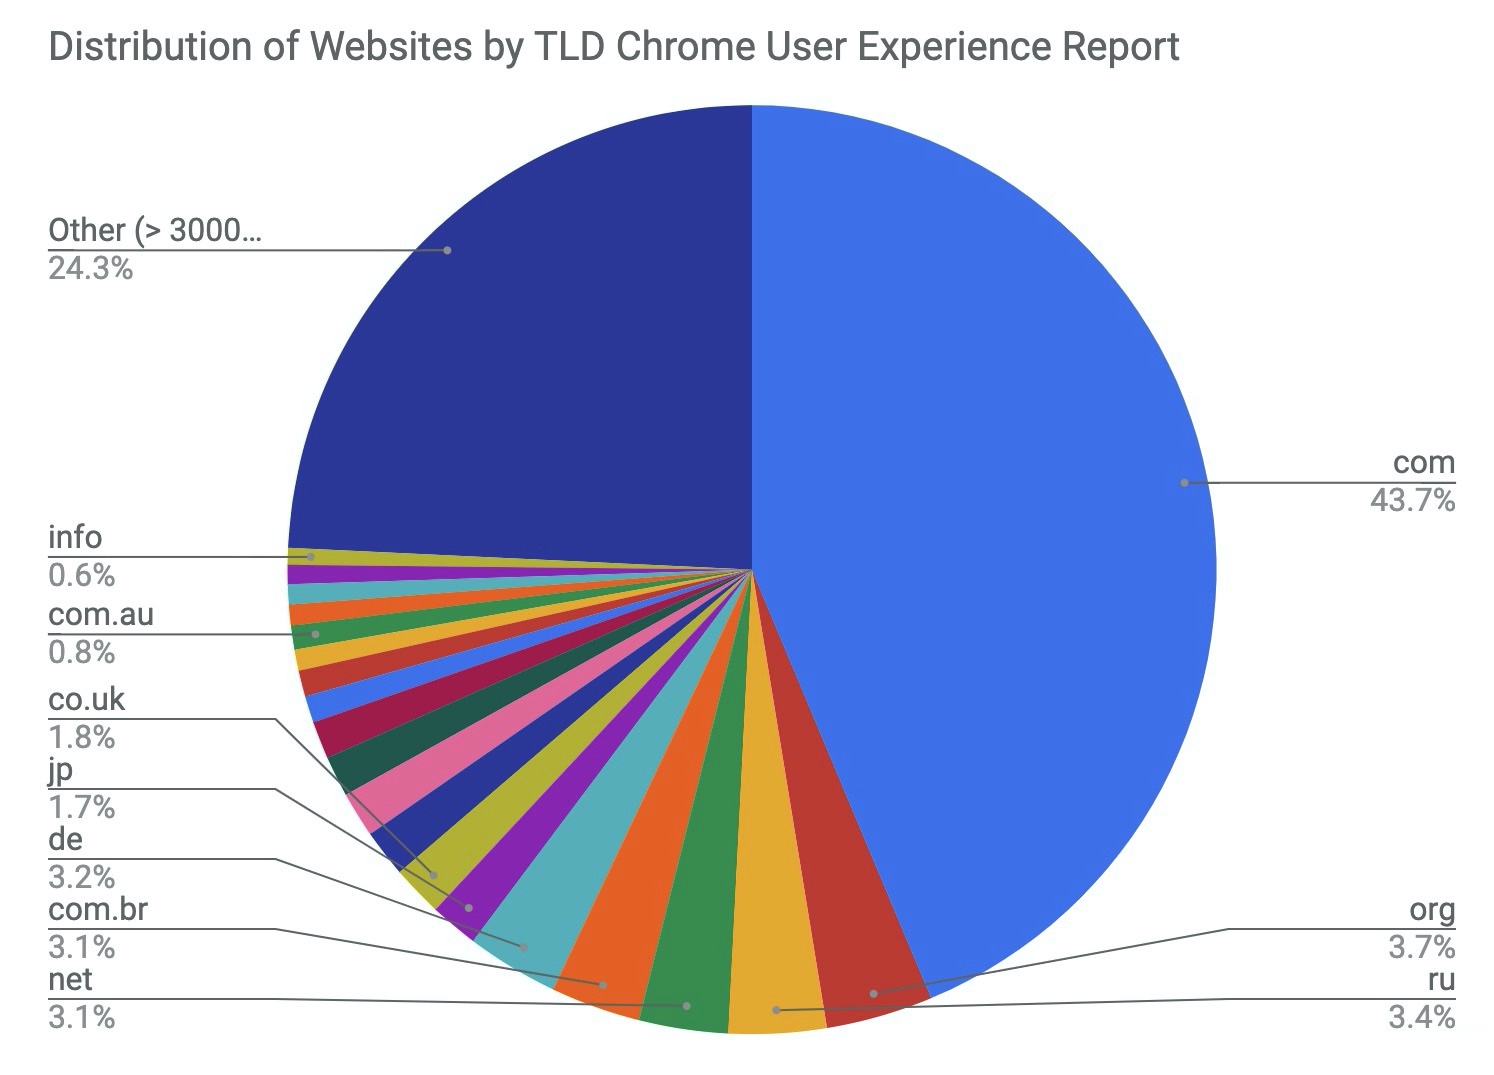
The .com top level domain accounts for 43.7% of all websites tracked in the Chrome User Experience report. The next largest top level domain is .org, which consists of 3.7% of all sites. Overall there were 4111 TLDs in the dataset, and the top 20 of them represented 75% of all websites.
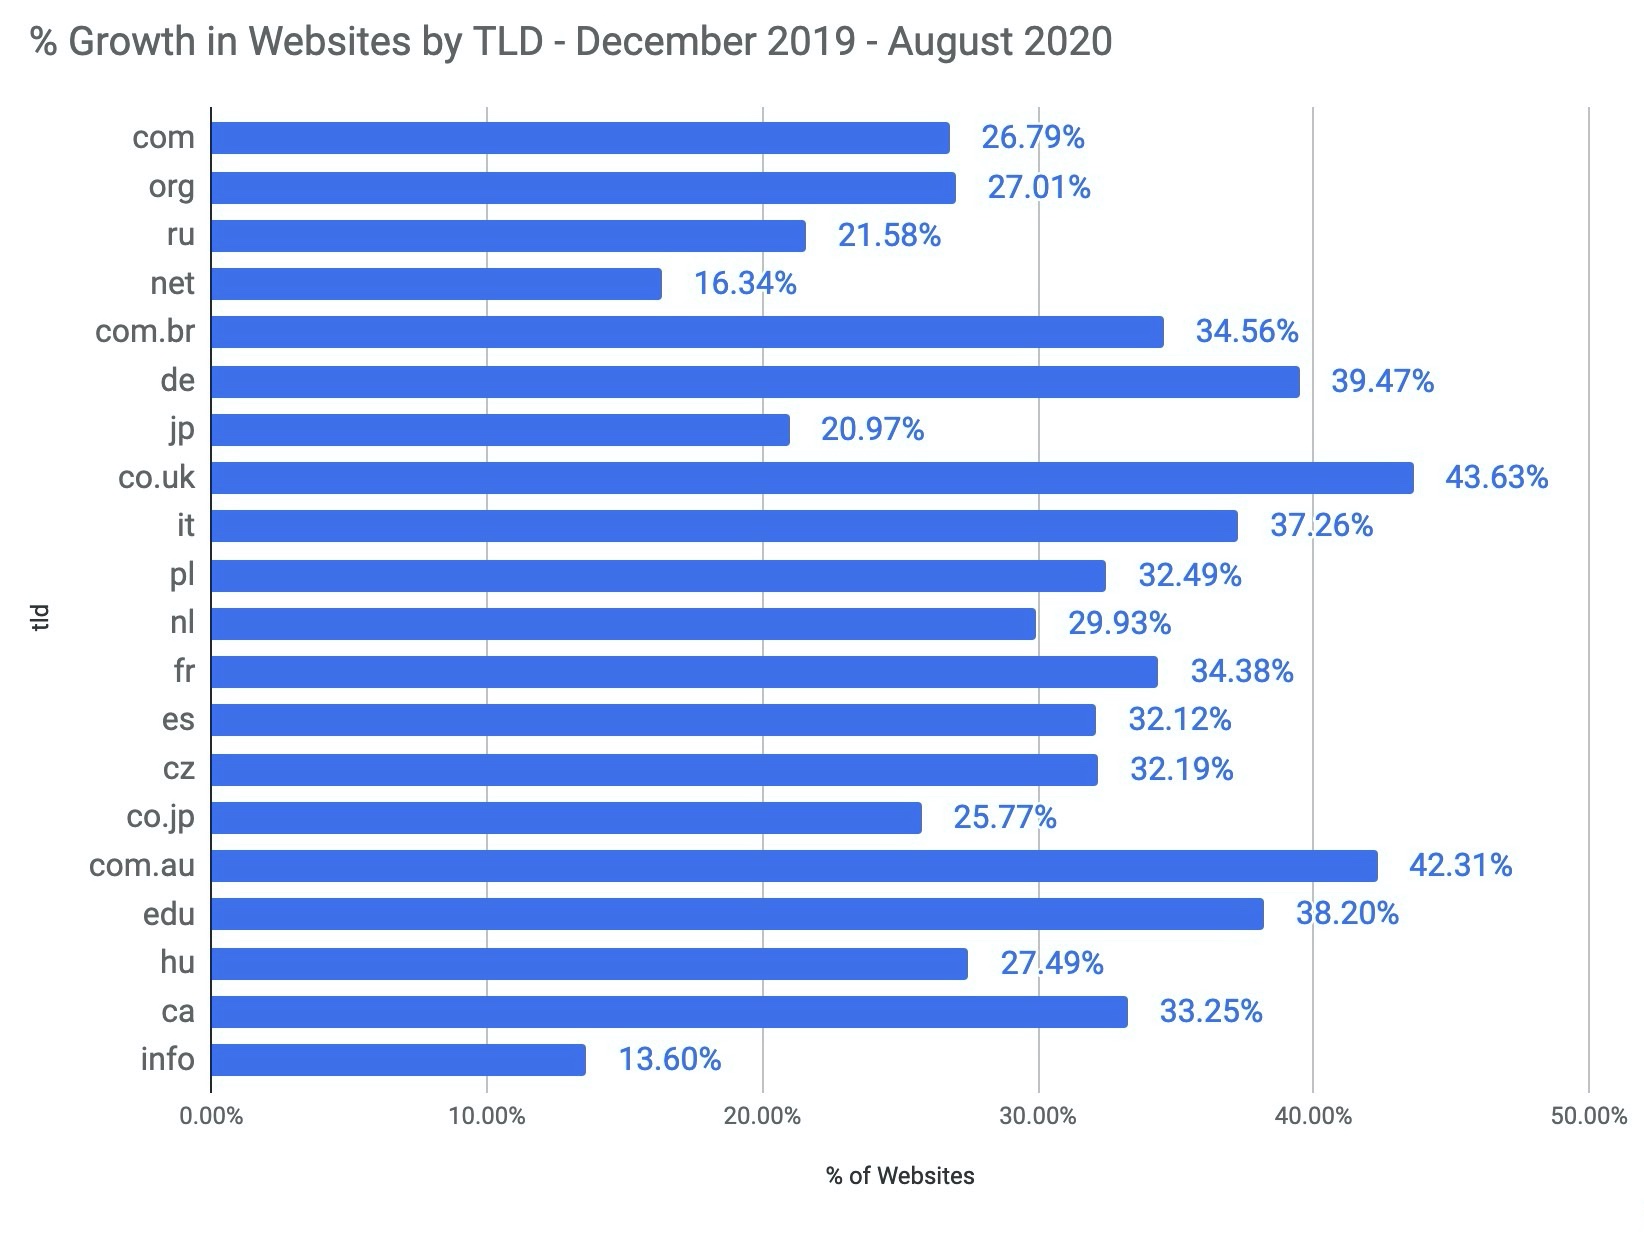
Most of these top level domains experienced a > 20% growth in active websites since December 2019, with the exception of .info and .net. The domains with the largest percentage growth were co.uk, com.au and de.
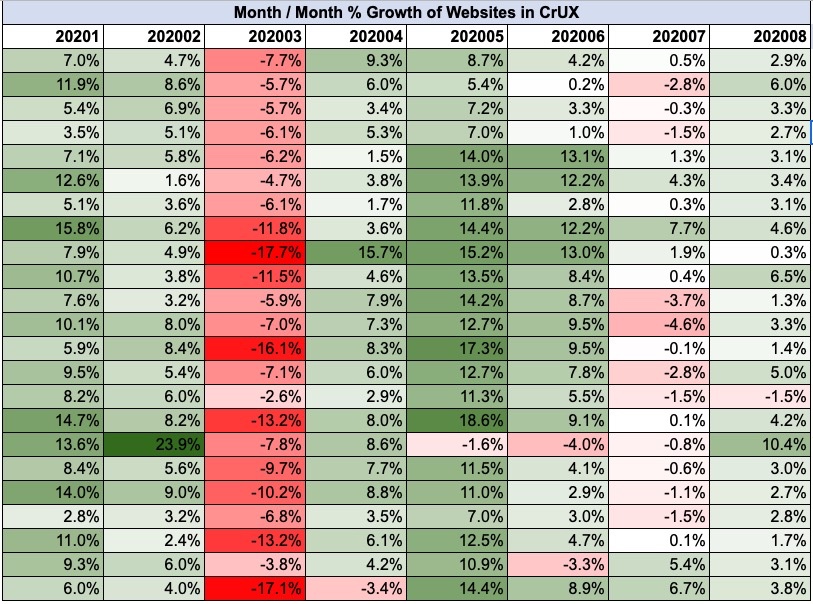
If we look at the month to month growth trends for these TLDs, we can make a few interesting observations:
- There was a significant drop across all TLDs in March 2020.
- The largest percentage drop was for .it domains in March 2020, although that rebounded with increases in April, May and June.
- In February 2020, there was a 23.9% increase in .edu domains receiving traffic.
- In May 2020, more than a dozen popular TLDs saw a double-digit increase in the number of sites.
- In August 2020 there was a 10.4% increase in edu domains
Conclusion
The web is constantly growing and evolving, and clearly it’s rate of growth can vary quite a bit. During this analysis we explored a public dataset that Google provides to show how the web has grown during 2020, and which regions are growing the most. While this doesn’t speak to the traffic levels experienced in these locations, the number of websites can be used as a proxy for understanding usage of the web. As this analysis shows, 2020 has been a year of substantial global growth for the web.
If you are interested in seeing some of the SQL queries and raw data used in this analysis, I’ve created a post with all the details in the HTTP Archive discussion forums. You can also see all the data used for these graphs in this Google Sheet.