Discovering Third Party Performance Risks
It likely comes as no surprise that third party content can be a significant contributor to slow loading websites and poor user experience. As performance engineers, we often need to find ways to balance requirements for their features with the strain that they can put on user experience. Unfortunately, for many sites this becomes a reaction to slowdowns and failures detected in production.
I thought it might be interesting to attempt to identify third parties that could pose a performance risk, so that they could be proactively analyzed. That led to building a tool called Third Party Explorer, which leverages WebpageTest data to help analyze a third party’s impact on a page load. The idea behind this tool is that some of the insights already collected during a WebPageTest measurement may enable you to prioritize a list of domains to evaluate proactively.
Why Are Third Parties Slow?
According to the Web Almanac, 94% of websites utilize at least one third party domain, and the median popular site uses 43 third parties. Not all third parties impact performance in the same way, but all it takes is one poorly configured third party. Often when someone discovers third party issues, it’s due to availability, loading performance, and interactivity delays caused by them.
When I think about how or whether a third party’s content may impact performance, I usually consider the following:
- When is the third party loaded?
- Is it render blocking?
- Does it load before important rendering metrics, such as First Contentful Paint or Largest Contentful Paint?
- Are there gaps in loading first party content that correlate to the third party?
- Are there gaps in loading other third party content that correlate to the third party?
- How is it delivered?
- How much content is served to the client?
- What type of content is served to the client?
- Is it using a Content Delivery Network to deliver resources?
- Is it allowing the browser to cache static resources?
- Are its resources compressed adequately?
- What is it doing?
- How much CPU time is used?
- Does it result in excessive long tasks?
- Does it result in excessive requests?
If you go down that list and answer these questions for a particular domain, you are likely to start forming an opinion of whether that third party could be a performance risk. It’s important to note that your analysis does not stop here, but rather it’s just beginning. If you suspect that a particular third party is a performance risk, testing, validating and ongoing monitoring should come after discovery.
Analyzing Third Party Performance in WebPageTest
When you run a measurement via WebPageTest, the existing reports can help you quickly identify some important third parties to analyze. For example, the graph below is a “Connection View”, which I find helpful when looking for gaps that correlate to the loading of a particular third party. Dark shaded bars also indicate data transfer, so it may be easy to spot third parties that have an excessive amount of darker shades in this view. Looking at this example, there are no gaps in the loading of first party content, most of the third party content is loading after LCP, and there are a few third parties that appear to be loading a lot of content.
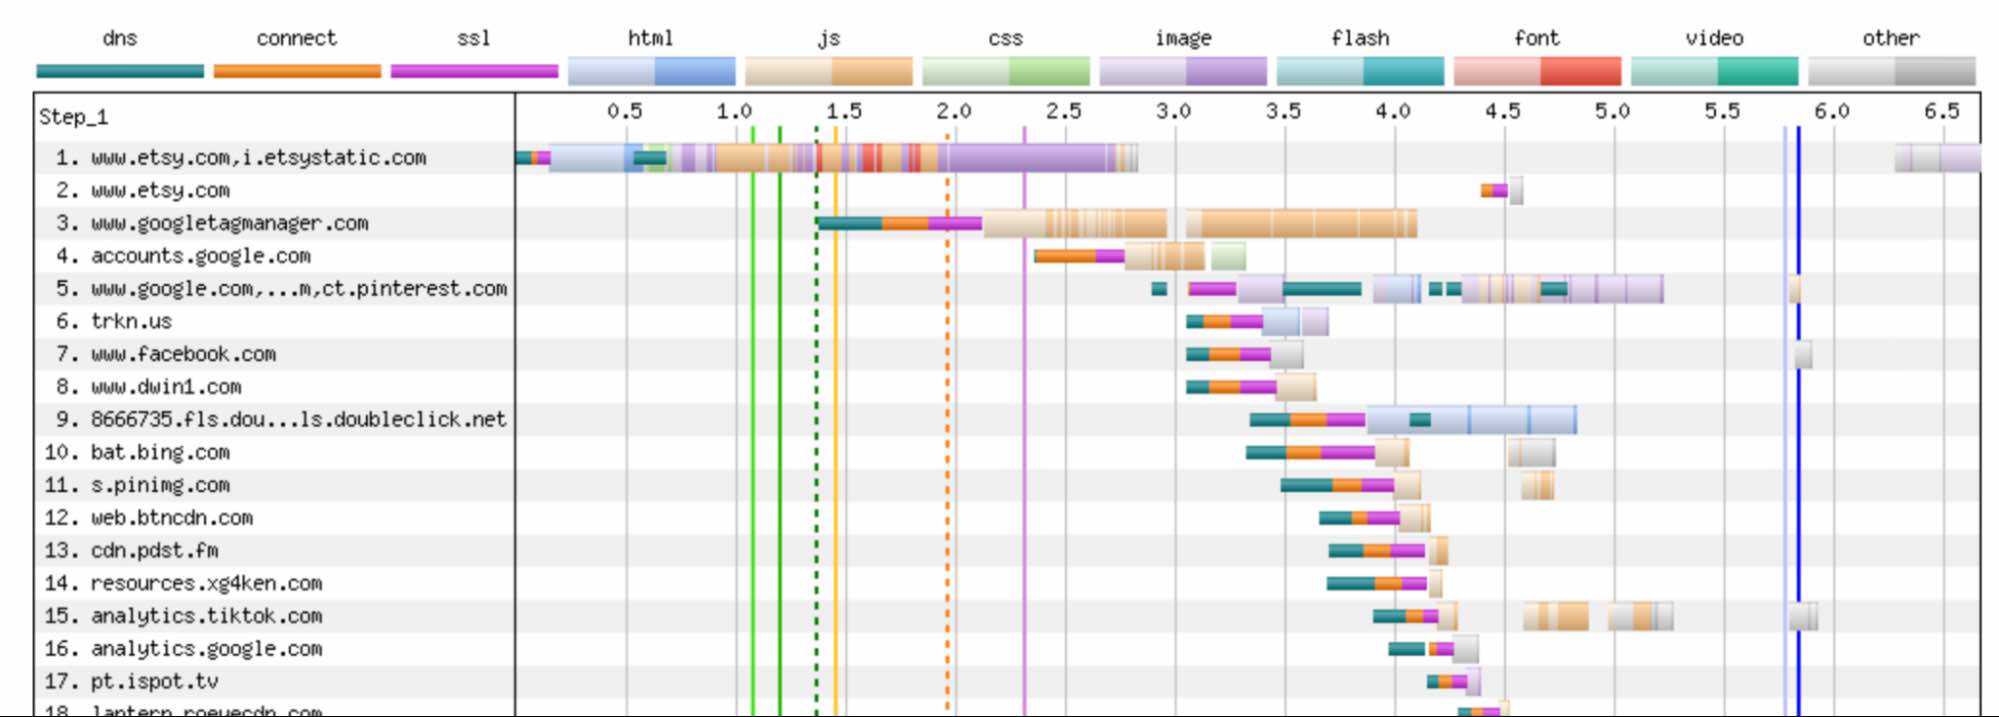
If this type of analysis is unfamiliar, then I highly recommend checking out Matt Hobb’s comprehensive guide to WebPageTest!
There are other interesting reports in WebPageTest that can be useful for analyzing third party content. For example, the “Domains Breakdown” report shows a summary of domains loaded on the site, as well as their request and byte count. The “Performance Optimization Overview” report shows a report card for each request, indicating whether a few performance best practices are met. And the “Opportunities & Experiments” section provides a comprehensive summary of some performance issues that were identified, with the option of running experiments using WebPageTest Pro.
Third Party Explorer
While WebPageTest provides a great deal of insight into third parties, sometimes it can be challenging to get a sense of which third parties to focus on. I wanted to build on top of the Domain Breakdown feature by creating a dashboard view that enables you to dive deeper. Fortunately all of this data exists in WebPageTest measurement results, so no further instrumentation was needed.
After navigating to the Third Party Explorer tool, enter a WebPageTest test result URL and click submit. This will download and parse the results from your WebPageTest measurement.
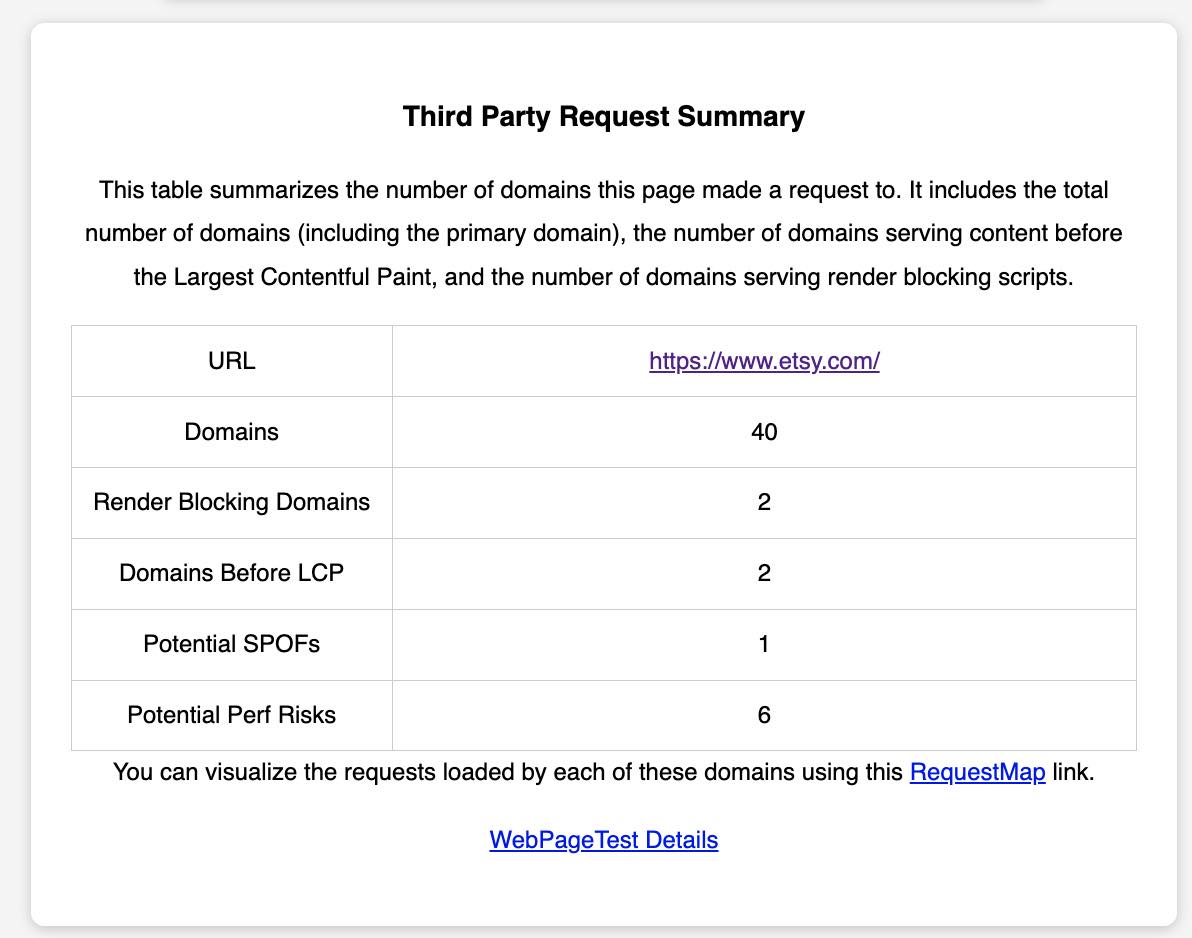
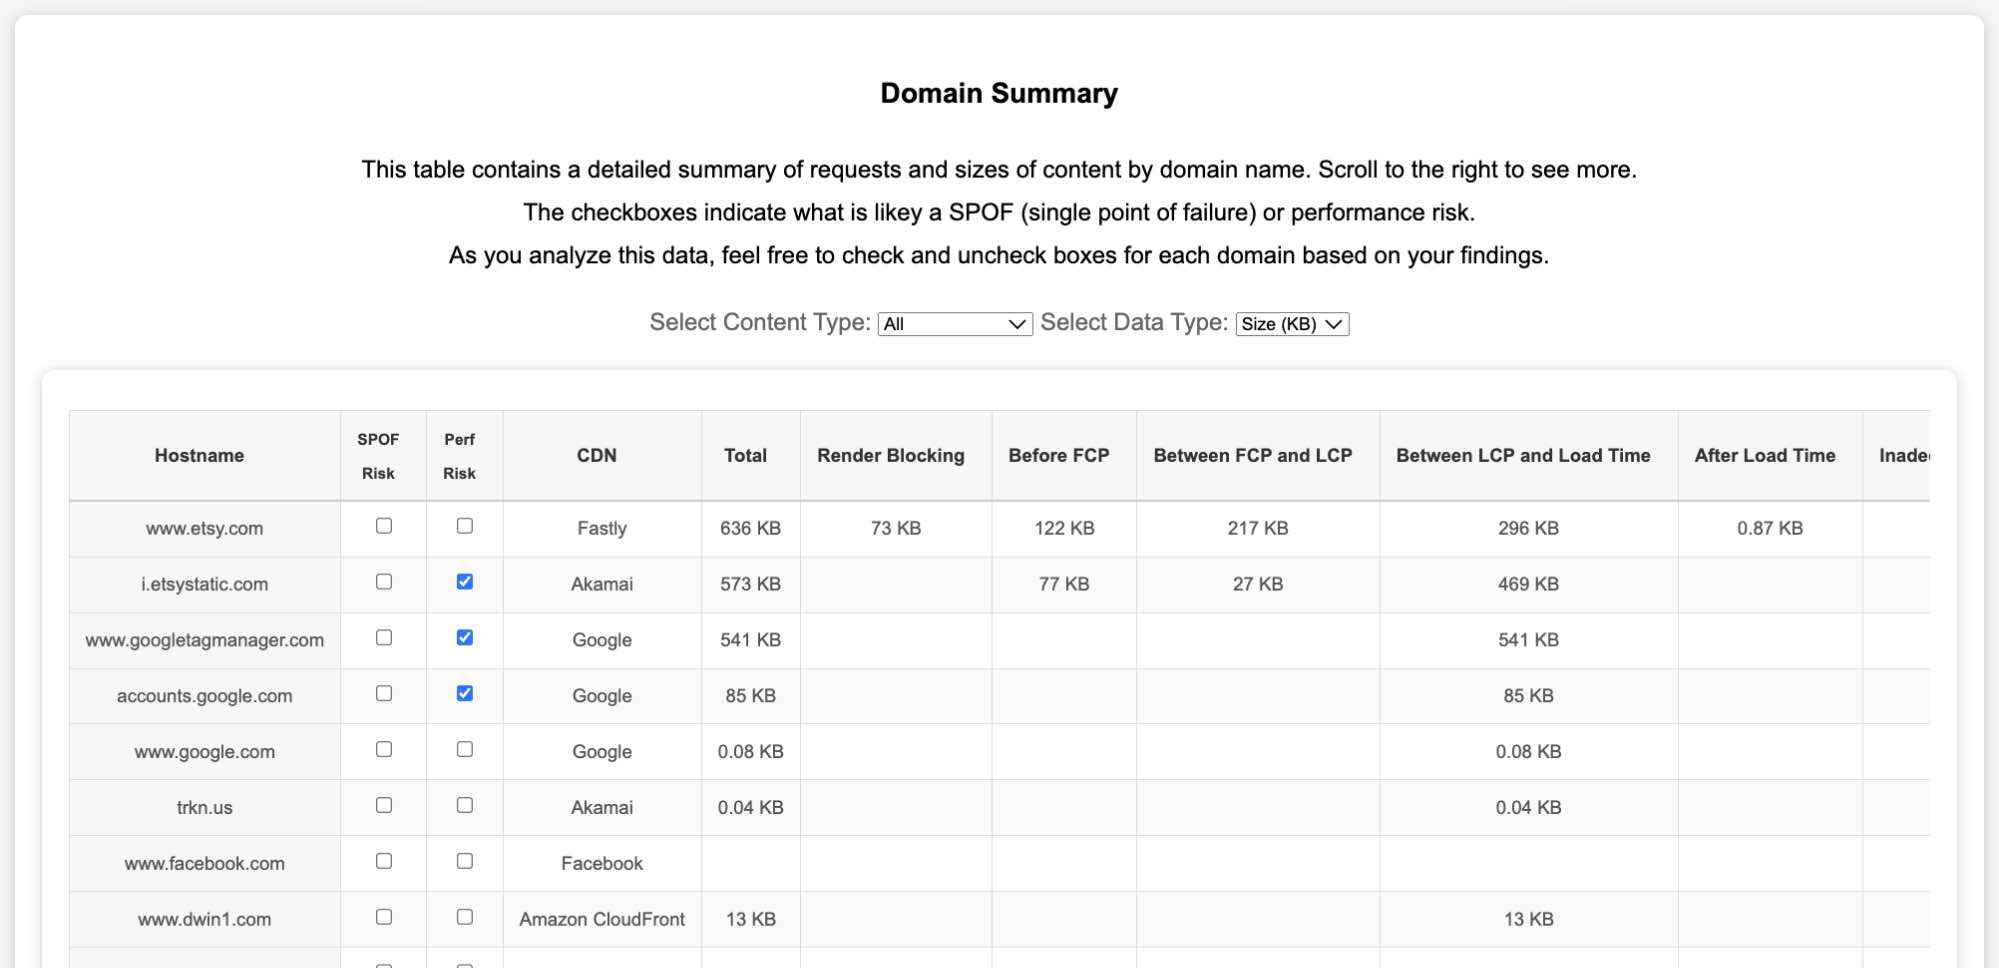
Once the test results are parsed, you can see a summary of the domains, including potential performance and SPOF risks. Note that I emphasize “potential” since you’ll really need to test your site to determine whether they are truly an issue.
Scroll down a little further, and you’ll see a list of domains. For each domain you can see the number of KB or requests loaded, and filter the results by content type. Each column is sortable. In the table you can see a lot of information (you may need to scroll to the right), such as:
- Whether the domain is using a CDN
- Number of requests and total bytes transferred
- Render blocking content
- A summary of third party requests or bytes between specific time ranges, such as before FCP, between FCP and LCP, etc.
- A summary of requests that have not been compressed
- Requests grouped by cache TTLs
- Requests grouped by CPU overhead
The two checkboxes in this table are for you to use. They are prepopulated with some suggestions based on the results, and alllow you to make a note of which domains to follow up on during your analysis. So you can check and uncheck domains during your analysis, and then review which ones to followup on later.
For example, sorting through these results, I can see that:
- Google Tag Manager and TikTok both have high CPU execution times, and load a lot of scripts between LCP and Page Load.
- The domain cdn.pdst.fm is loading 22KB of JavaScript, which is not compressed.
- The domain js.adsrvr.org is render blocking, but loads towards the end of the HTML body.
While it seems like we’re in pretty good shape, there’s still a few things that we could improve on here. When I started building this tool there were a few more third parties in this list - some with significant performance issues such as inadequate compression levels, large JavaScript payloads that were not cached on a CDN, and cacheable content delivered via S3 instead of a CDN. Fortunately the third parties acted on feedback I shared with them and addressed the issues. I’ve started using this tool to proactively assess the performance impact of third parties prior to integration.
What are Perf Risks and SPOF Risks?
In the domain summary, you’ll find two checkboxes next to each domain, labeled “Perf Risk” and SPOF Risk”. If you find this checked for a domain, it doesn’t necessary mean that it’s a problem - but that it’s worth reviewing the domain to determine whether it is. I used a simple rubric based on my own experiences/opinions for determining which domains to label as a performance risk or a single point of failure risk:
You’ll find SPOF risk checked if the domain has at least one render blocking request.
You’ll find Perf risk checked if:
- Overall
- A domain has at least one render blocking request
- If a domain has more than 10KB of text based content that is not compressed with gzip, brotli or zstd
- If a domain is delivering at more than 20KB requests (excluding XHRs) without a CDN
- Before LCP
- A domain loads more than 30KB of content
- A domain loads any requests (excluding XHRs) that are not cacheable, have no cache policy or have a TTL of 0s
- A domain’s scripts utilizes over 30ms or more CPU time (compile + evaluate + execute)
- Between LCP and Page Load
- A domain loads more than 50KB of content
- A domain loads requests (excluding XHRs) that are not cacheable, have no cache policy or have a TTL of 0s
- A domain’s scripts utilizes over 50ms or more CPU time (compile + evaluate + execute)
- After Page Load
- A domain loads more than 100KB of content
- A domain’s scripts utilizes over 100ms or more CPU time (compile + evaluate + execute)
Feel free to use the checkboxes to select or deselect domains that you feel are not applicable to your site. And if you have ideas on a better rubric for a third party peformance risks, I’m open to suggestions!
Bringing it Back to WebPageTest for a Deeper Analysis
Now that we’ve reviewed how to use the tool, go run a WebPageTest measurement and see what you can find. Once you have some third parties to investigate, there’s a few things you can try:
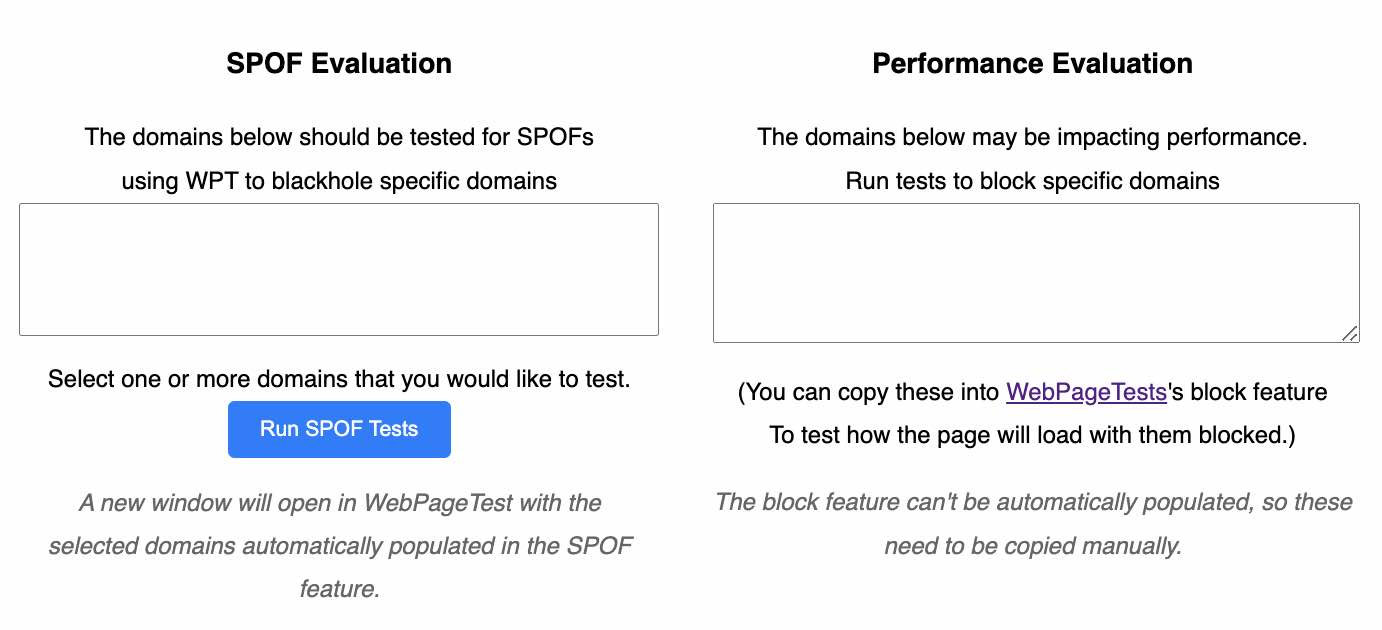
At the bottom of the Third Party Explorer tool you will find sections for “SPOF Evaluation” and “Performance Evaluation”. If you use the checkboxes in the tool to mark up which third parties you are concerned about, then you can use these sections to launch a SPOF test via WebPageTest or to populate a list of domains to block. This will enable you to run WebPageTest measurements to see what your user experience would be like if the third party failed or if it was removed.
If you subscribe to WebPageTest Pro, check out the list of “Opportunities & Experiments” and try to see what optimizing a particular third party might do. From there you can experiment with blocking third parties, running them as first party content, etc.
Conclusion
Third party performance is no doubt a significant cause of poor user experience on the web. While it can be challenging to identify poorly performing third parties proactively, attempting to do so during the evaluation stage of implementing one can prove to be mutually beneficial for both you and the third party.
There’s no shortage of great tools out there that will help you identify when a third party is slowing down your site. The goal of this article was to help you proactively assess whether a third party meets a criteria that merits some further review and analysis.