Gauge User Experience with Time to Interactive

As web developers, we want to give our users the best possible experience, and so we tend to focus on how fast the page loads. In a recent blog post here, Flattening the Earth: Testing and Improving Content Delivery, the author uses WebPageTest to test how fast a page loads in various environments. But page loading speed alone doesn’t give us the full picture on the user’s experience.
One often overlooked factor is JavaScript execution time, which is an additional delay to the time it takes to download resources. The fact is, users won’t care about a page being visually complete if they can’t interact with it, and so it’s important to measure how long it takes for a page to become interactive.
If you’ve run a WebPageTest measurement recently, you may have noticed a new metric that shows up in the summary table labeled “Interactive (beta)”. This is a new metric and an exciting evolution in how browser based-performance is being measured.
Time to Interactive is defined by WebPageTest as the time until the page being loaded is considered usable and will respond to user input. (Specifically, it is the first interactive window after the first meaningful paint where there is a contiguous period of 5 seconds within the interactive window.) It was adapted from Google’s Lighthouse extension.
Understanding Time to Interactive
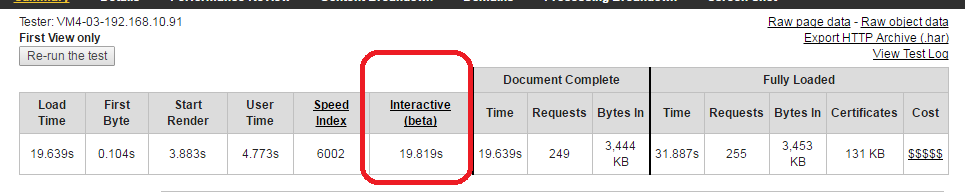
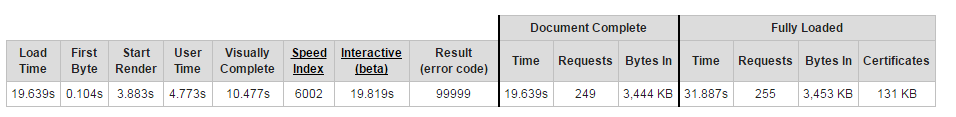
Take a look at the following example WebPageTest measurement. From just the timing metrics we can see that the DOM Interactive fired at 2.783 seconds. The page started to render at 3.883 seconds and then Document Complete occurred at 19.639 seconds. Time to Interactive was considered 19.819 seconds – almost 200ms after DOM Complete.
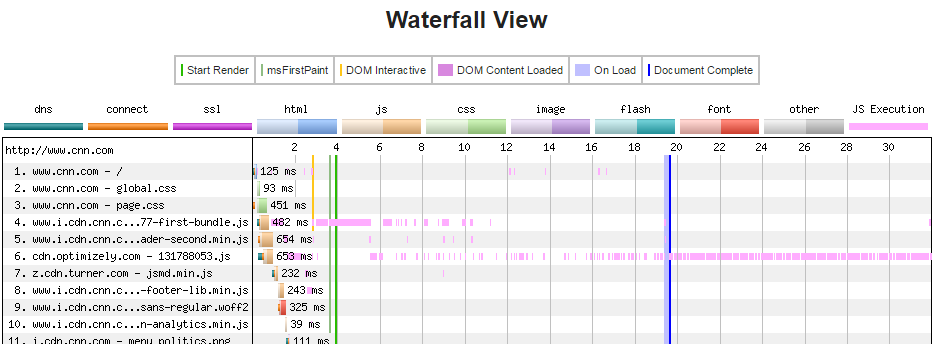
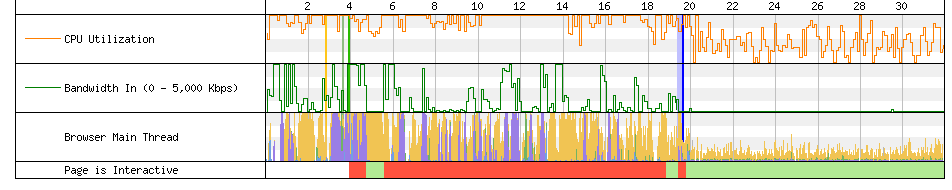
When you scroll down to the bottom of the waterfall graph, you can see CPU Utilization, Bandwidth and browser thread usage. There is also a “Page is Interactive” indicator, which shows that the page became interactive at 2.783 seconds – before anything was even painted to the screen. The page became interactive again at ~4.5 seconds, and then due to JavaScript execution the page was no longer interactive. A short period of time after DOM Complete fired, the page became interactive again.
This metric was discussed in depth in a WebPageTest GitHub Issue #781, and it’s worth reading that in full if this is something that interests you.
Note that TTI may not show up in every WebPageTest measurement, since it requires 5 seconds of idle time on the browser main thread to calculate. If you want to see this in a WebPageTest measurement, update your test settings to increase the minimum test duration to at least 5 seconds longer than you expect the page to load.
What Does This Mean For Developers?
The industry is working on more accurately describing end-user performance, and this puts script execution time into focus. Script execution time is one of the often ignored delays that a web application can experience, and it can be an incredibly frustrating experience for end users.
Akamai customers that have a lot of 3rd party JavaScript may want to analyze the time to interactive measurement for their pages. This is a metric that is impacted by script execution time, not the downloading of resources. Basic content delivery won’t affect it, but the results combined with JavaScript profiling from browser developer tools can help identify some of their biggest offenders.
Once you’ve identified what is causing the TTI delays, then you can decide on how to handle it. For example:
- Akamai’s front-end optimization (FEO) solution may help by asynchronously executing some of that JavaScript.
- Preconnect (available in FEO and Adaptive Acceleration) can help reduce protocol overhead of 3rd party content, which may have an impact on when the JavaScript is executed. It won’t affect the execution time of the JavaScript, but may indirectly impact the TTI by making the scripts execute sooner.
- The biggest offenders should be evaluated, and a decision should be made to either remove it or find a way to reduce the performance impact.
While there is still no absolute metric that defines a user’s experience on a web page – Time to Interactive is a great step forward.
Originally published at https://developer.akamai.com/blog/2017/04/12/gauge-user-experience-time-interactive/