Correlating Performance Metrics to Page Characteristics
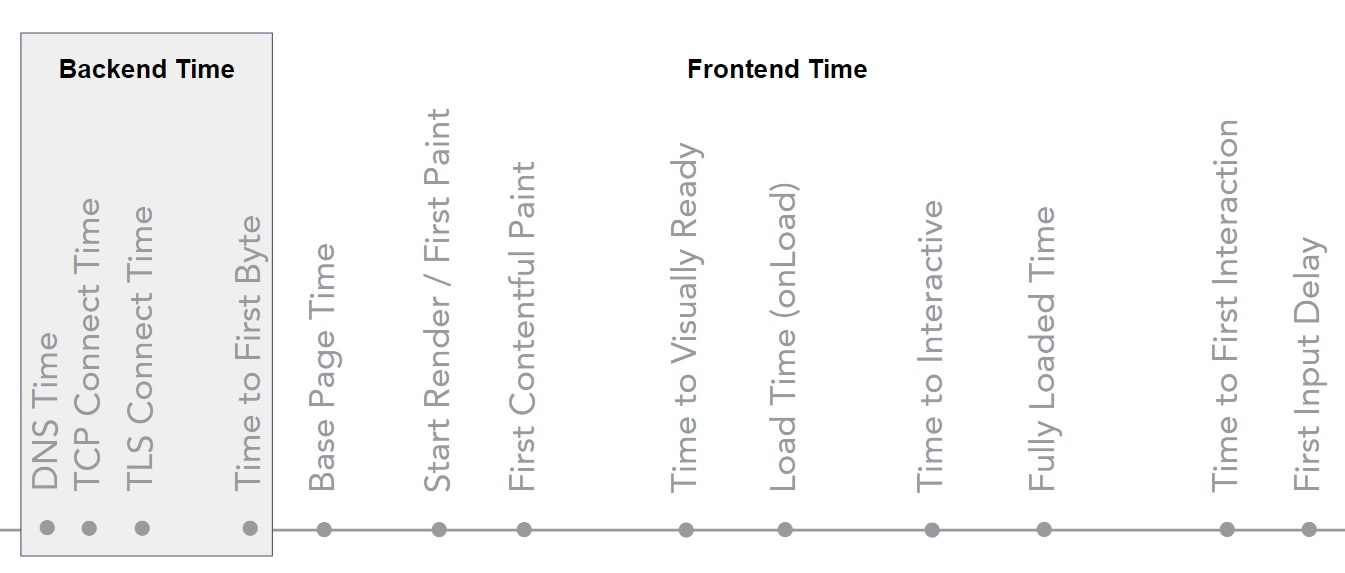
When we talk about web performance measurement, there is a long list of metrics to choose from. As an industry we are converging on metrics that gauge user experience – such as “Time to Interactive” and “Time to Visually Ready”. Other metrics such as onLoad and First Contentful Paint are also widely used and available in most browsers via APIs such as Navigation Timing and Paint Timing. And then there are Speed Index, Start Render, Fully Loaded time and many others, including protocol times (DNS/TCP/TLS) and backend times (TTFB). You are optimizing your sites and have all these measurements at your disposal – so what do you use to evaluate your changes?
Let’s say you have a page that loads in 5 seconds (onLoad) and you make a small improvement that shaves off 100ms during the critical render path. If you measure your improvement with the onLoad metric then you’ll see a mere 2% performance improvement. Such a small percentage might make some question the value in investing your time on such an optimization. However if you look at what it is optimizing – the critical render path – and then choose a metric that gauges it (such as First Contentful Paint), you may see an improvement as high as 10% during the critical render path. Conversely, if you optimize your JavaScript and reduce the processing overhead then Time to Interactive would be the metric to use. Don’t box yourself into using a single metric for everything. It’s best to figure out what you are optimizing for, and then how to measure that.
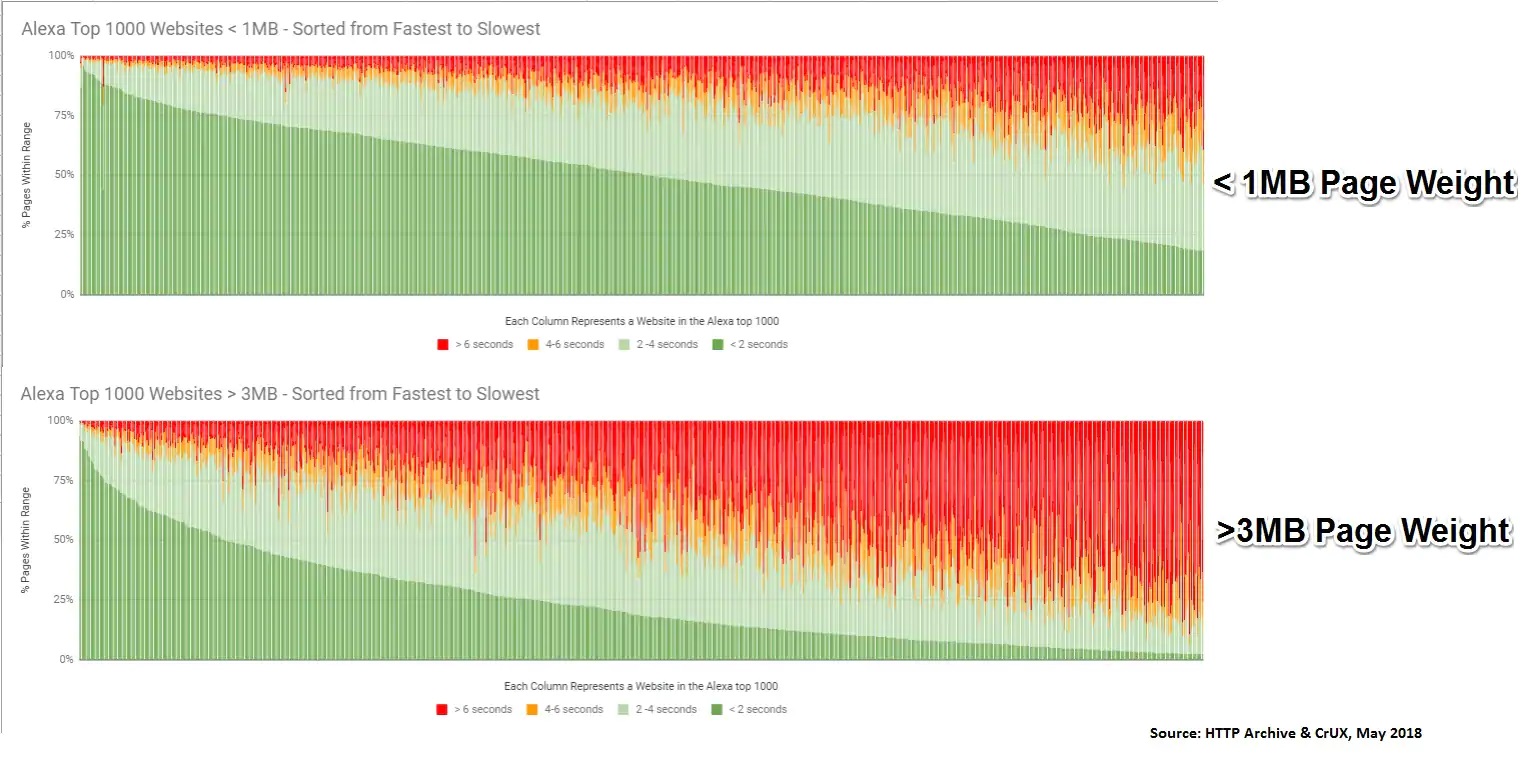
The HTTP Archive gives us the ability to dig into countless insights about how web pages are built. We can use this data to correlate these page attributes to different performance metrics. For example, a few months ago I was able to correlate page weight to performance and found that onLoad times of larger pages were slower. When I looked at the First Contentful Paint metrics I was not able to see the same correlation. In this article we’ll go a bit deeper and explore some more correlations across a wider set of metrics.
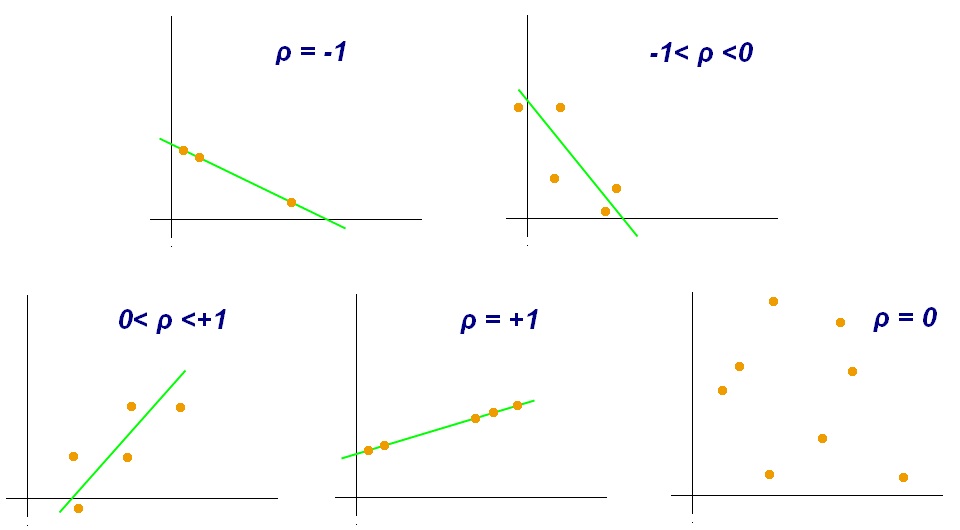
In statistics, the Pearson Correlation Coefficient is a measure of the linear correlation between two variables. The coefficient ranges from -1 to 1, where 1 implies a perfect linear relationship, 0 implies no linear correlation and -1 implies that an inverse correlation is present (ie, Y decreases while X increases).
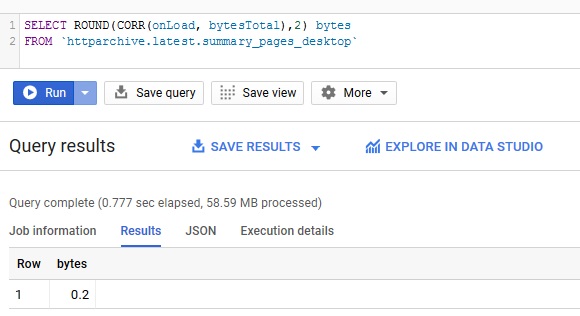
Google BigQuery has a built in aggregate function that can calculate the pearson correlation coefficient for a set of number pairs. In order to use it, we just need to call the CORR() function and pass it the two columns we want to correlate. For example, correlating Page Weight to Load Time via the HTTP Archive would be as simple as:
We can expand this query to look at the correlation between First Contentful Paint and Page Weight as well.
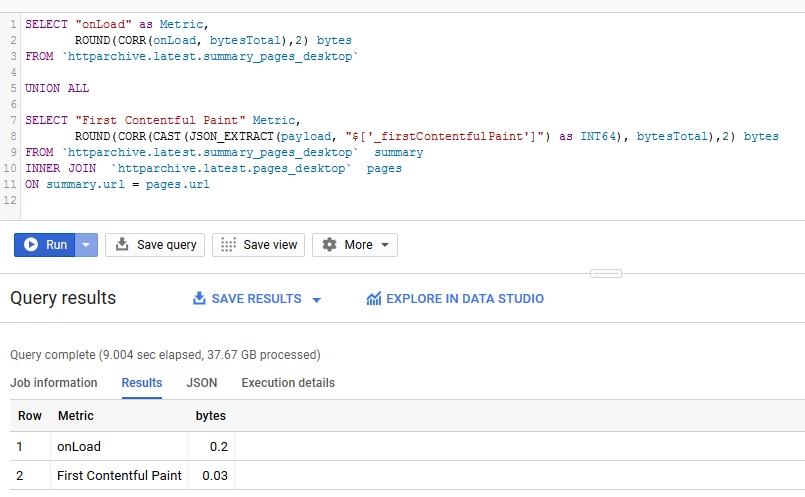
The output of this shows that the pearson correlation coefficient for onLoad vs Total Page Weight is 0.20. The first contentful paint correlation is 0.03, which is significantly lower and consistent with my earlier observation. The closer the coefficient is to 1, the stronger the relationship between the two variables. Based on this, there is a slight correlation between page weight and onLoad time, but not for first contentful paint.
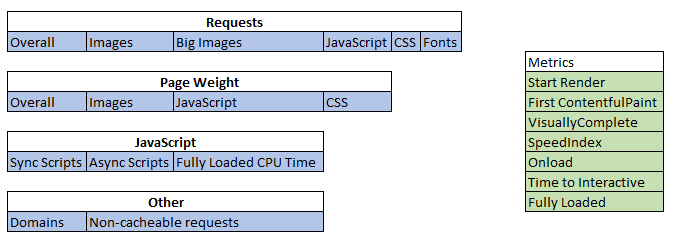
Now let’s expand this to include other metrics and page characteristics. In the example below I’m going to correlate the following characteristics of requests, page weight, JavaScript loading and more with a set of web performance metrics.
Note: The performance measurements in this analysis are from HTTP Archive and not real user measurement sources such as CrUX or mPulse. We’ll be looking at 1 measurement for each of the ~4 million sites to get a snapshot of the correlation. I strongly recommend measuring your performance improvement via RUM to understand how it impacts user populations at different percentiles.
The query for this includes UNION’ed queries for each metric. The CORR() function is called for each of the attributes mentioned above as well. It’s a rather large query, and you can see the full query here (Note: this will process 38GB of data).
In the table below, the correlation values for each page characteristic are highlighted based on their strength compared to each metric Dark green indicates that there is a strong correlation. The lighter shades indicate that the correlation is weaker, and red indicates a negative correlation.
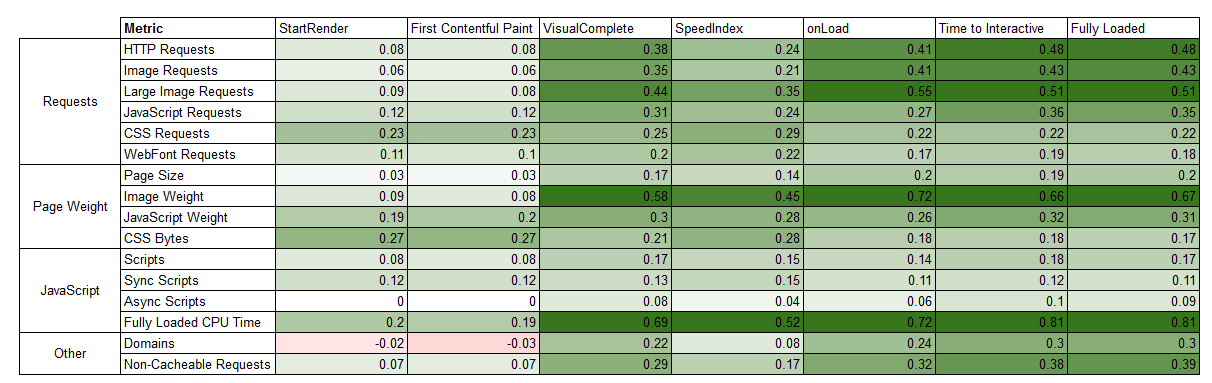
The results provide a lot of insight into where you may be able to measure some optimizations. For example, factors more likely to affect rendering of pages include the number of CSS requests, amount of JavaScript and CPU overhead. Image weight is measurable to onLoad, while JavaScript impacts are most noticeable at Time To Interactive and Fully Loaded, but is not as impactful to onLoad
Conclusion
Your mileage will vary from site to site, but the results here show a strong correlation between some particular characteristics of page design and key performance metrics. It’s also just as important to understand that you may not see a noticeable impact across all measurements for a particular optimization. Understanding what you are optimizing for, and then how you plan to measure it is critical.
Originally published at https://discuss.httparchive.org/t/correlating-performance-metrics-to-page-characteristics/1548