Page Visibility: If a tree falls in the forest…
If a tree falls in the forest and no one is around, does it make a sound? Likewise, if a web page loads in a background tab then does its load time really matter? As a user, the time it takes for background tabs to load may seem irrelevant since you are unlikely to notice delays. However if you are managing a website and measuring user experience, then it’s important to understand how visibility state can influence the data you are analyzing.
In this blog post we’ll explore the Page Visibility API as well as some data from Akamai’s mPulse to understand the visibility states of real users loading billions of page views, and what it means for web performance.
Page Visibility
The Page Visibility API defines a programmatic way of determining the visibility state of a top-level browsing content, as well as a method of measuring visibility state changes over time. Web developers can use this information to determine whether a page is visible to an end user. It also gives them the ability to scale back the work being performed on a page load. The Page Visibility API is also supported in all modern web browsers.
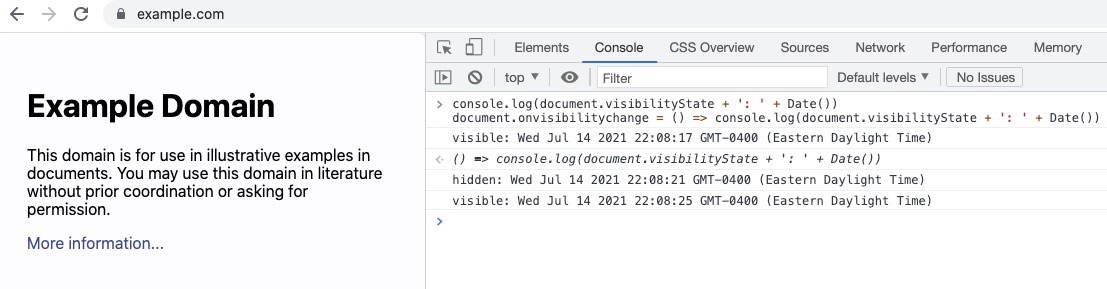
Using this API is very simple. The attribute document.visibiltyState will return visible or hidden depending on whether the page is visible or not. If you want to see the value changing as you switch tabs, you can also monitor the visibility changes. For example,
console.log(document.visibilityState + ': ' + Date())
document.onvisibilitychange = () => console.log(document.visibilityState + ': ' + Date())
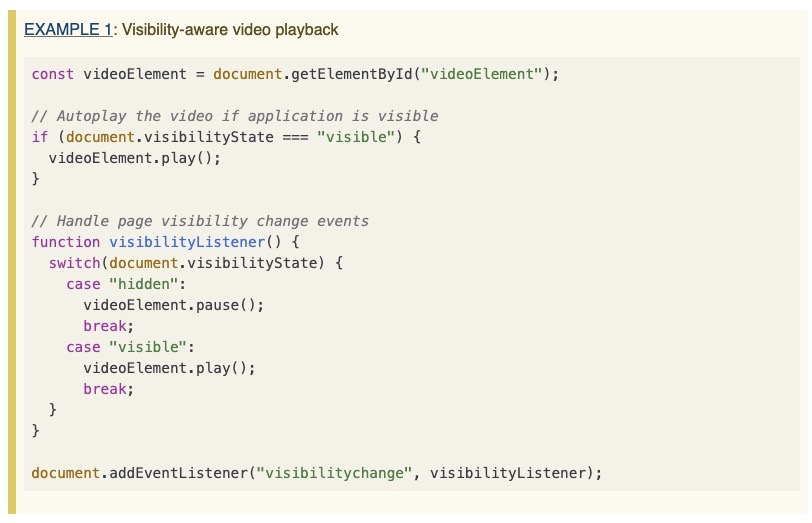
The W3C specification, also provides an example of using this API to decide whether to autoplay a video on page load based on visibility state. It adds an event listener to listen for changes in the visibility state so that the video playback can start automatically when the page is visible.
RUM tools can collect this data as well. For example, mPulse collects the visibility state of a page once the page load has completed and also measures for changes in visibility throughout the page load.
The data in this blog post is based on billions of page views across all sites using mPulse during the month of November 2021.
Visibility States
How often do you right click on a link and load a page in a background tab? Or click on a link on your mobile device and switch applications before it finishes loading? Or lock the screen on your mobile device while waiting for a page to load?
The graph below breaks down visibility states by device type using RUM data from mPulse. The visibility state is measured as soon as the onLoad event is fired. 11.18% of all Desktop page views were loaded in a hidden visibility state. Similarly, 9.59% of Mobile page views were loaded in a hidden visibility state.
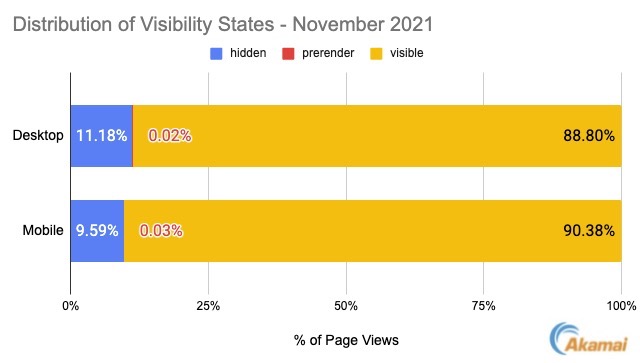
Note: Less than 1% of pages were loaded in a prerender state. This feature has been deprecated in the Page Visibility API, supported inconsistently across browsers, and therefore not as useful for this analysis.
Why is Visibility State Important for Web Performance?
Most modern browsers prioritize work being done in the foreground, and as such one would expect that a page loaded in a background tab may be slower. Individually you can examine this behavior by loading a page and looking at it’s navigation timing data. Load that same page in a non-visible tab a few times and look at the difference in timing.
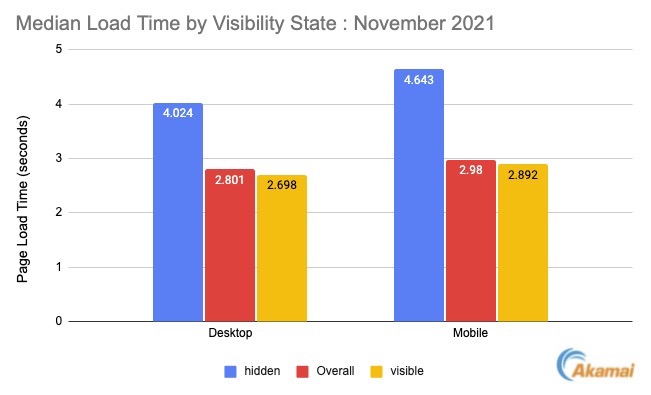
When analyzing the median page load time (onLoad metric) in mPulse, I can see a significant difference in performance based on visibility state. For example, the median time to load a page on Desktop was 2.8 seconds. The median load time for pages in a visible state was 2.7 seconds and the median load time in a hidden state took 4 seconds. The median load times for pages loaded in a hidden visibility state was 32% slower on Desktop and 37% slower on Mobile!
Going back to the tree falling in a forest analogy, does this really matter? I’d say yes and no, for the following reasons:
- From a user experience, if the page is not visible then the user is not impacted by the delay.
- As performance engineers we look to RUM data to tell us what our users are experiencing. If a large enough percentage of users are loading tabs in the background, then it may impact the metrics we are analyzing. This is exacerbated even further if you are looking at upper percentile stats.
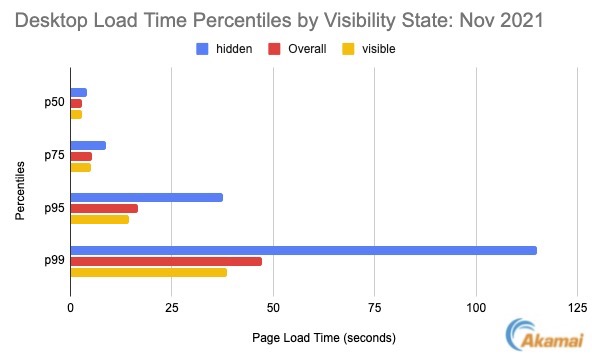
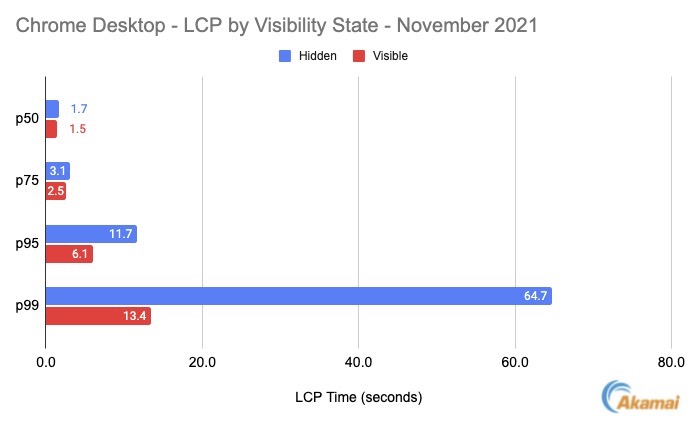
The graph below illustrates the median load times as well as the p75, p95 and p99 based on visibility state. The p95 for all Desktop pages loaded in a visible state was 14.37 seconds. Comparatively, the page load times for hidden states was 37.65 seconds, which is more than twice as slow!.
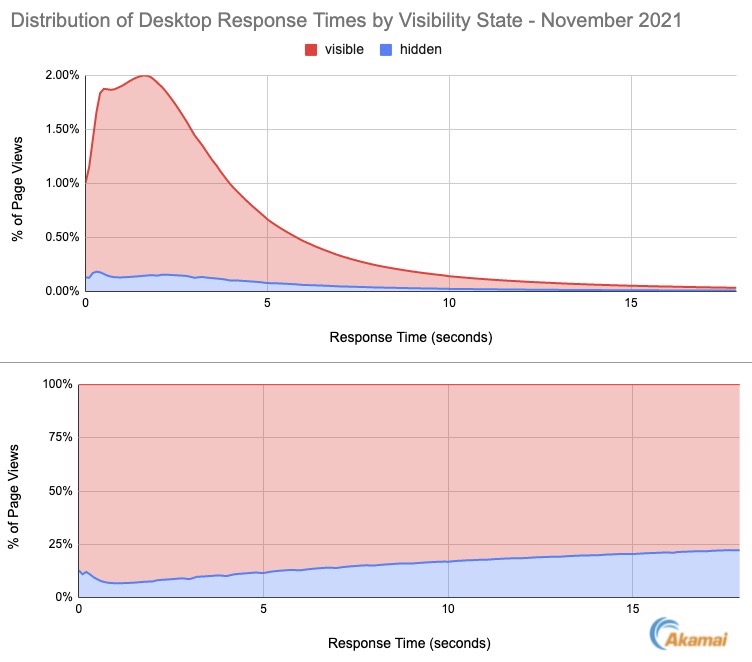
Taking this one step further, the graph below shows the distribution of load times in a histogram, for both hidden and visible states. As the response times increase, hidden visibility states account for a larger percentage of experiences. At the 95th percentile, 25% of all pages were loaded in a hidden visibility state. (Note: the x axis in this graph ends at 18 seconds, which is around the 95th percentile).
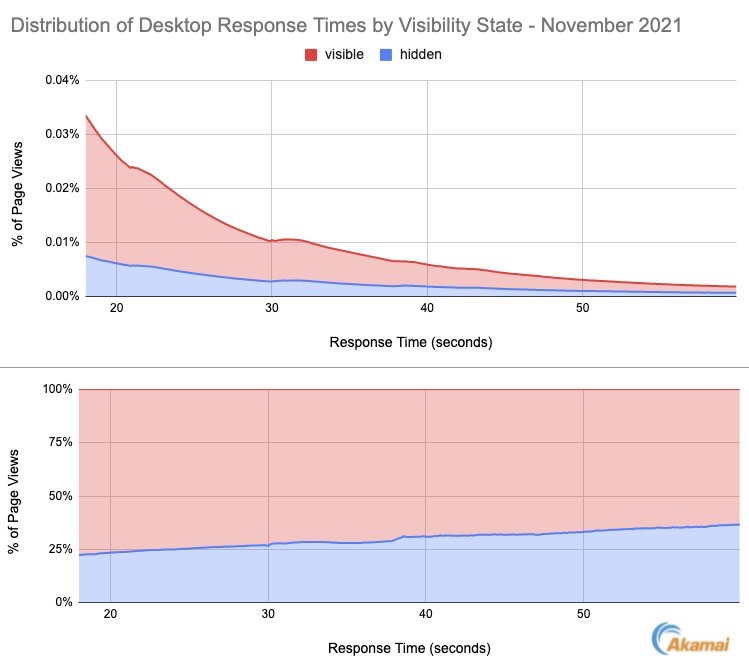
Now let’s explore the upper percentiles. The graph below shows the same data for the slowest 5% of experiences. The percentage of hidden visibility states increases with respect to the load time, eventually approaching 36%. If you are analyzing upper percentiles to tackle some of your long tail performance issues - then not filtering out hidden visibility states will leave a significant amount of noise in your data.
Page visibility by desktop browser
During the month of November 2021, Chrome, Edge, Safari, Firefox and Internet Explorer accounted for 96.3% of all desktop page views. Chrome was the dominant browser, with 63.9% of all page views. However all of these browsers support the page visibility API.
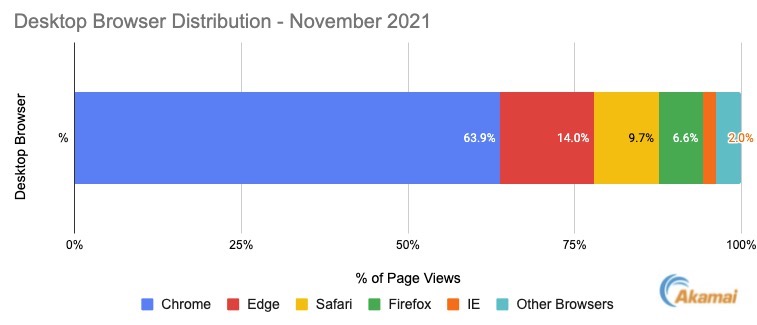
The table below details the distribution of visibility states by Desktop browser. The percentage of hidden visibility states varies widely by browser. This may be influenced by a variety of factors, such as browser UI features (such as tabbed browsing) or by the end user switching between applications on their machine.
Chrome had the highest percentage of hidden visibility state page loads (12.9%) compared to other desktop browsers. Interestingly, Edge (which is now Chromium based) had 7.86% of page loads. Given that legacy Internet Explorer (version 11 and earlier) had only 4.4% hidden visibility states, it’s possible that some users of Edge and Internet Explorer are less likely to utilize the tabbed browsing features.
| % of page loads by visibility state | ||
| Browser | hidden | visible |
| Chrome | 12.91% | 87.09% |
| Edge | 7.86% | 92.14% |
| Safari | 6.86% | 92.89% |
| Firefox | 9.25% | 90.75% |
| IE | 4.44% | 95.56% |
It’s worth noting that if you are measuring your site with a synthetic measurement, you are almost always loading a page in a visible state.
Page visibility by mobile browser
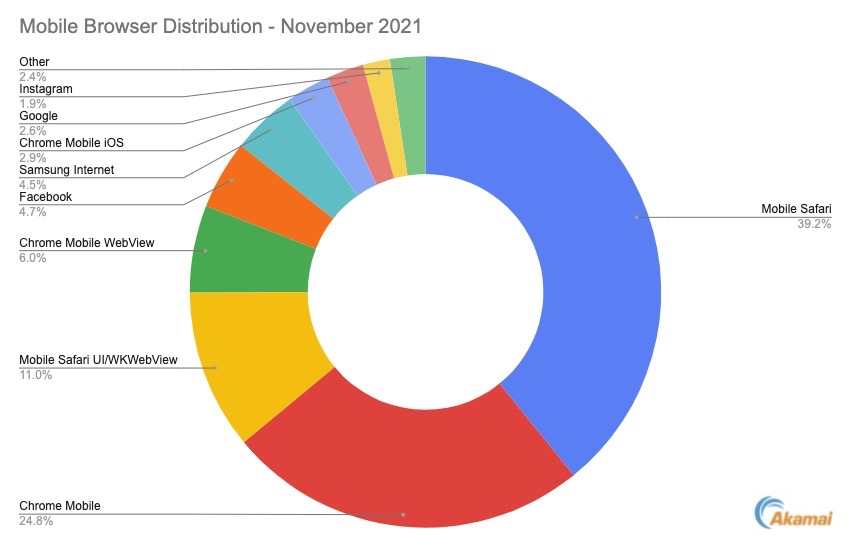
Mobile web traffic is split between browser apps, WebViews, and in-app browsers. Mobile Safari is the dominant mobile browser, with 39.2% of page loads. WebViews also represented a significant traffic share, accounting for 17% of all mobile page views (or 20% if we include Chrome Mobile and Firefox Mobile’s iOS apps).
The table below breaks down the visibility states measured by mobile web browsers. Overall, 5.98% of pages on Mobile Safari were loaded in a hidden visibility state, which is comparable to Desktop. However Chrome Mobile had less hidden visibility states (8.88% mobile vs 12.91% desktop). Interestingly, some Chromium based mobile browsers (such as Samsung Internet, MiuiBrowser and Edge Mobile) had a much higher percentage of hidden visibility states - likely due to differences in their UI and user base.
| % of page loads by visibility state | ||
| Browser | hidden | visible |
| Mobile Safari | 5.98% | 93.99% |
| Chrome Mobile | 8.88% | 91.12% |
| Samsung Internet | 12.34% | 87.66% |
| Crosswalk | 2.93% | 97.07% |
| Firefox Mobile | 2.48% | 97.52% |
| MiuiBrowser | 16.43% | 83.57% |
| Opera Mobile | 12.45% | 87.55% |
| Yandex Browser | 6.16% | 93.83% |
| Edge Mobile | 10.10% | 89.89% |
| UC Browser | 9.74% | 90.25% |
When we look at distribution of visibility states across WebView’s and in-app browsers, we can see that WebViews have the highest percentage of hidden visibility states. This could be due to mobile users switching apps or locking their screens before a page is finished loading.
Another interesting observation is that the social media apps Instagram and Snapchat have a higher % of hidden visibility states compared to Facebook and Pinterest. Could this be due to differences in demographics of these platforms?
| % of page loads by visibility state | ||
| Browser | hidden | visible |
| Mobile Safari UI/WKWebView | 26.61% | 73.20% |
| Chrome Mobile WebView | 12.73% | 87.27% |
2.78% | 97.22% | |
| Chrome Mobile iOS | 7.77% | 92.20% |
7.16% | 92.83% | |
| LINE | 1.87% | 98.12% |
| Firefox iOS | 6.24% | 93.75% |
| Snapchat | 9.46% | 90.48% |
| Android Webkit | 4.41% | 95.59% |
3.69% | 96.31% | |
One thing in common across all browsers - desktop and mobile - is that there are a significant amount of hidden visibility states that are worth accounting for in our performance measurements.
Beyond page load time
When we look at other performance metrics, we can see that times measured for metrics such as Total Blocking Time, Largest Contentful Paint and First Contentful Paint were also impacted by visibility state. The graph below illustrates this for Chrome Desktop pages. The metric that was most impacted was Total Blocking Time, which was almost twice as slow when hidden. This makes sense since the browser is likely not prioritizing the execution of JavaScript on the page, which also explains the 46% increase in page load times
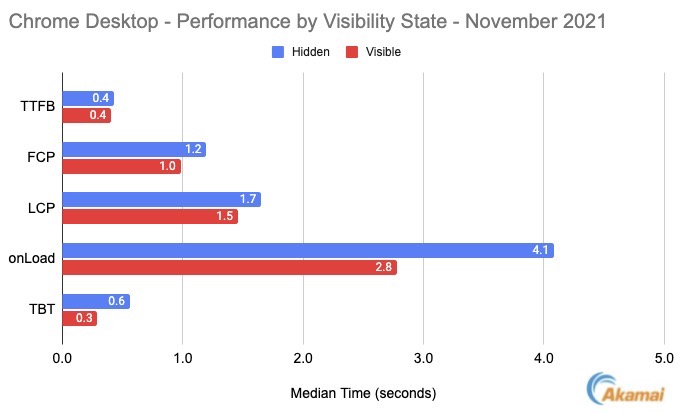
Largest Contentful Paint is one of the Core Web Vitals, which Google is using as a signal for search ranking. The mPulse data shows us that the p75 LCP for a hidden visibility state is 23% slower than when it is visible. At the p95, the LCP is almost twice as slow when hidden.
Google’s Chrome User Experience Report (CrUX) already filters out hidden visibility states, which means that your search ranking will not be impacted by slow non-visible page loads. However the tools you are using to monitor these thresholds may have a blind spot here. Fortunately it’s easy enough to collect visibility state data using the Page Visibility API. For example, in mPulse, the visibility state is a dimension that you can filter in any dashboard. You can also create custom dashboards to track the distribution of experiences based on visibility states if that interests you.
Conclusion
The Page Visibility API is an incredibly useful way of determining the visibility state of a page load. It can be used to provide developers with the ability to fine tune experiences based on visibility state, which can conserve CPU and battery usage. It’s also measurable with RUM, and based on the data from mPulse we can see that page load times are slower across all browsers when the visibility state is hidden.
While this may not matter as much for end user experience, it’s happening at a high enough frequency that it can influence your performance metrics. If you are optimizing for the long tail of web performance, you may want to filter out hidden visibility states.
Originally published at https://calendar.perfplanet.com/2021/page-visibility-if-a-tree-falls-in-the-forest/