Impact of Page Weight on Load Time
Over the years it has been fun to track website page weight by comparing it to milestones such as the size of a floppy disk (1.44MB), the size of the original install size of DOOM (2.39MB) and when it hit 3MB last summer.
[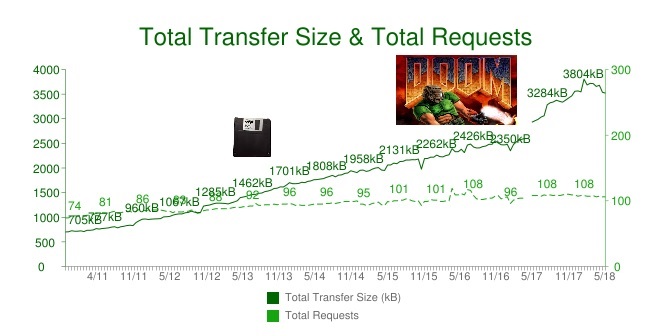
When we talk about page weight, we are often talking about high resolution images, large hero videos, excessive 3rd party content, JavaScript bloat – and the list goes on.
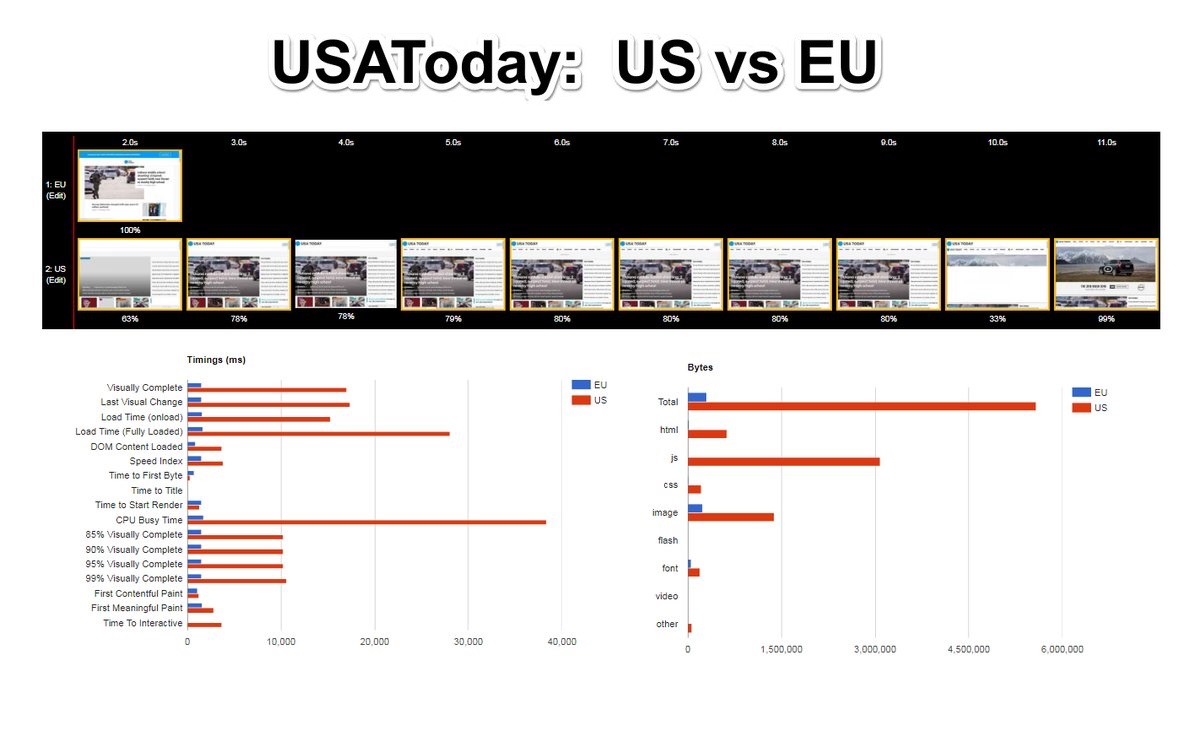
I recently did some research to show that sites with more 3rd party content are more likely to be slower. And then a few days later USAToday showed us an extreme example by publishing a GDPR friendly version of their site for EU visitors. The EU version has no 3rd party content, substantially less page weight and is blazing fast compared to the US version.
[
Shortly after the 3MB average page weight milestone was reached last summer, I did some analysis to try and understand the sudden jump in page weight. It turns out that the largest 5% of pages were influencing the average, which is a perfect example of averages misleading us.
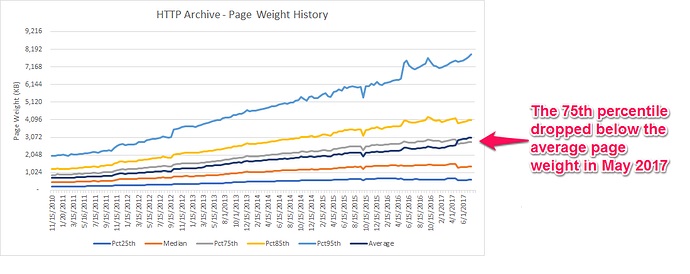
These days we focus more on percentiles, histograms and statistical distributions to represent page weight. For example, in the image below you can see how this is being represented in the recently redesigned HTTP Archive reports.
[
Is page weight still something we should care about in 2018?
Thanks to the HTTP Archive, we have the ability to analyze how the web is built. And by combining it with the Chrome User Experience Report (CrUX), we can also see how this translates into the actual end user experiences across these sites. This is an extremely powerful combination.
Note: If you are not familiar with CrUX, it is Real User Measurement data collected by Google from Chrome users who have opted-in to syncing their browsing history and have usage statistic reporting enabled. I wrote about CruX and created some overview videos if you are interested in learning more about the data and how to work with it.
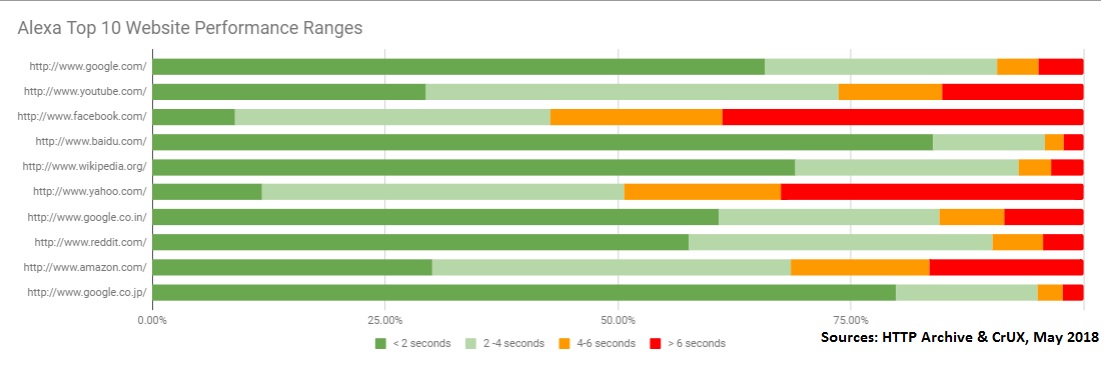
By leveraging CrUX and the HTTP Archive together, we can analyze performance across many websites and look for trends. For example, below you can see how often the Alexa top 10 sites are able to load pages in less than 2 seconds, 2-4 seconds, 4-6 seconds and greater than 6 seconds. It’s easy to glance that this chart and see which sites have a large percentage of slower pages. I wrote a another post about how we can use CrUX data like this to compare yourself to competitors.
[
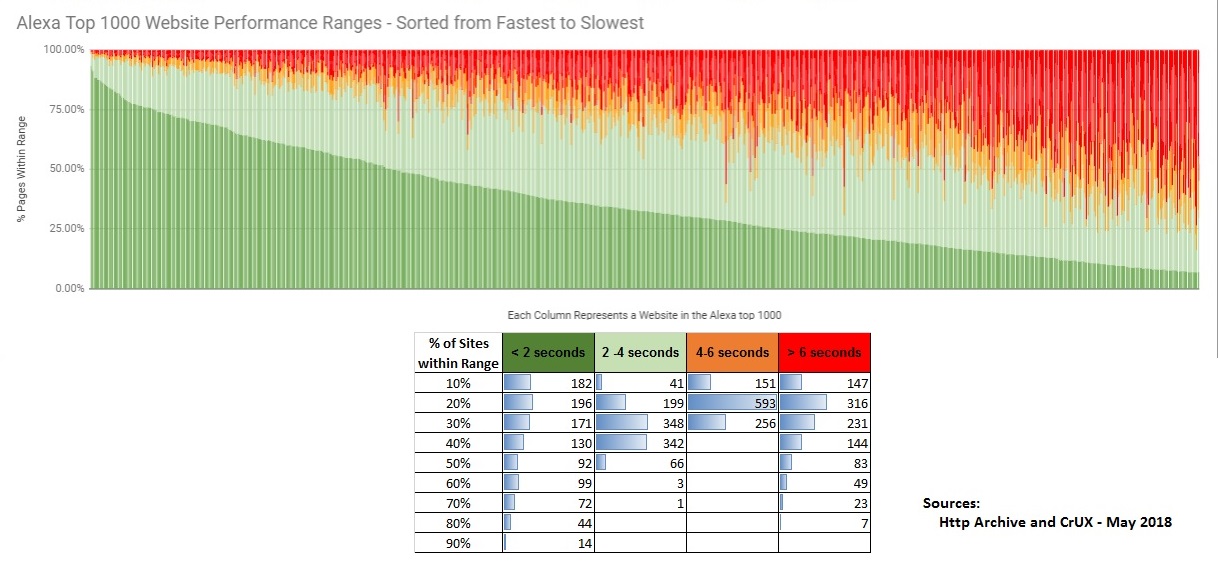
But what happens if we look at the real user performance for 1,000 popular sites this way? The results are oddly symmetrical, with almost as many fast sites as slow ones. In the graph below I sorted the onLoad metrics from fast (left) to slow (right). There are 1000 tiny bars – each representing a summary of a single website’s real user experiences on Chrome browsers. The most consistently fast site in this list is the webcomic XKCD – with an impressive 93.5% of users loading pages in < 2 seconds. Some other sites in the “extremely fast” category are Google, Bing, CraigsList, Gov.uk, etc. Many of the slow sites (far right of this graph) have large page weights, videos, advertisements and numerous 3rd parties. Where do you think your site’s performance stacks up?
[
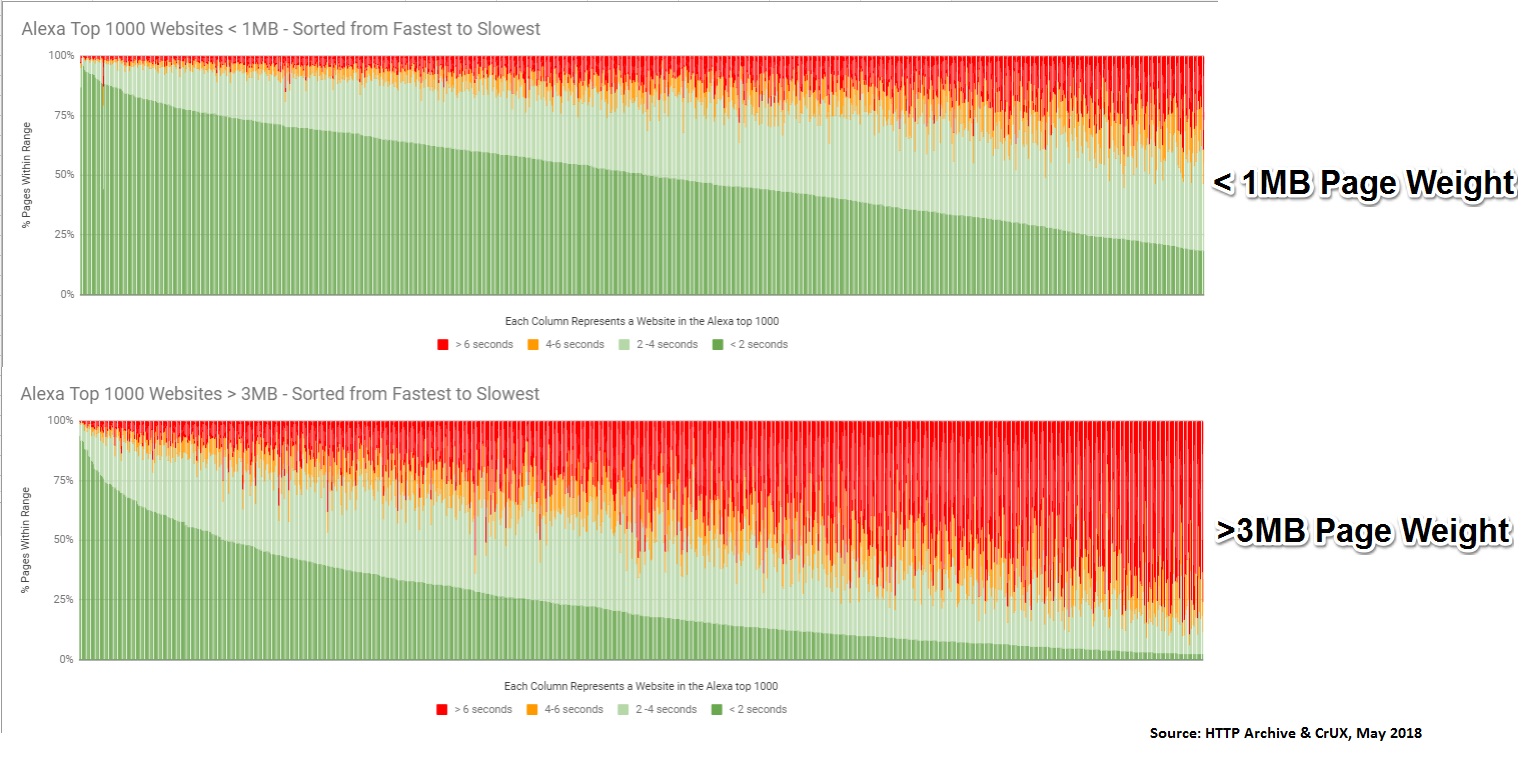
Since we’re interested in investigating the relationship of page weight to performance, let’s look at the top 1000 pages that are less than 1MB and the top 1000 pages that are greater than 3MB. The pattern in load times is quite revealing. A few notable observations:
- The distribution of fast vs slow seems to be cut down the middle. Sites appear to either be mostly fast or mostly slow
- There are far more fast <1MB pages compared to slow ones
- There are far more slow >3MB pages compared to fast ones.
- The fact that there are still some fast >3MB pages and slow <1MB pages proves that page weight isn’t everything, and it is possible to optimize rich experiences for performance.
[
Note: I’ve also applied the same logic to the top 10,000 sites, and the pattern was identical.
What About the Other Metrics that CrUX Collects?
Since CrUX contains additional metrics, I also looked at the relationship of page weight to DOM Content Loaded and First Contentful Paint. The set of graphs below compare the fastest range (<2s for onLoad, <1s for FCP and DCL) for the top 1000 sites. Across these three metrics, we see the highest correlation of load times to page weight with the onLoad metric.
[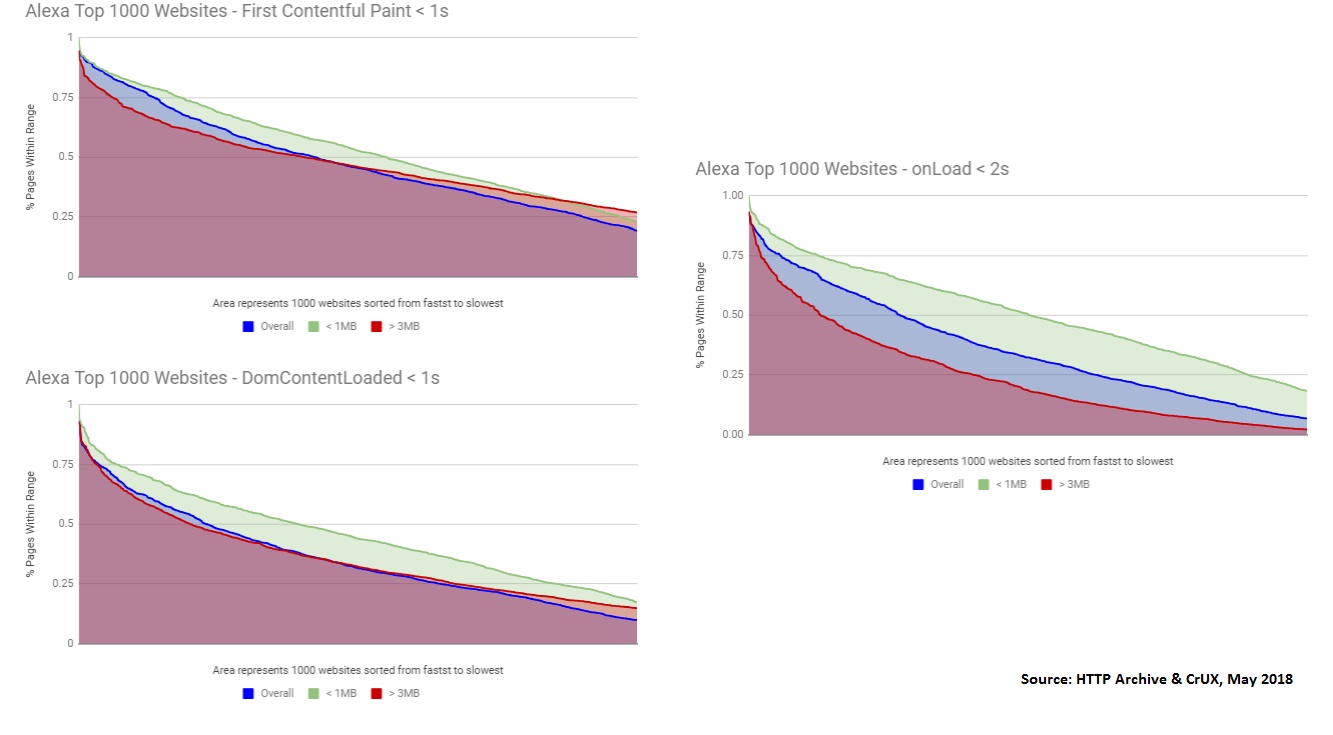 (Note: the higher %s mean that more pages experienced faster load times. So higher=better in these graphs.)
What Aspects of Page Weight Impacts Performance the Most?
We’ve seen a strong correlation of performance to page weight, and we’ve learned that this is more measurable via onLoad vs First Contentful Paint. But what contributing factors of page weight impact load times the most?
If we examine the Top 1000 sites again and pull some of the page weight statistics from the HTTP Archive, we can once again compare HTTP Archive data w/ CrUX. The graphs below summarize the percentage of pages with onLoad times less than 2 seconds. The Y axis is the median number of bytes, and the X axis represents the percentage of sites with fast page loads.
[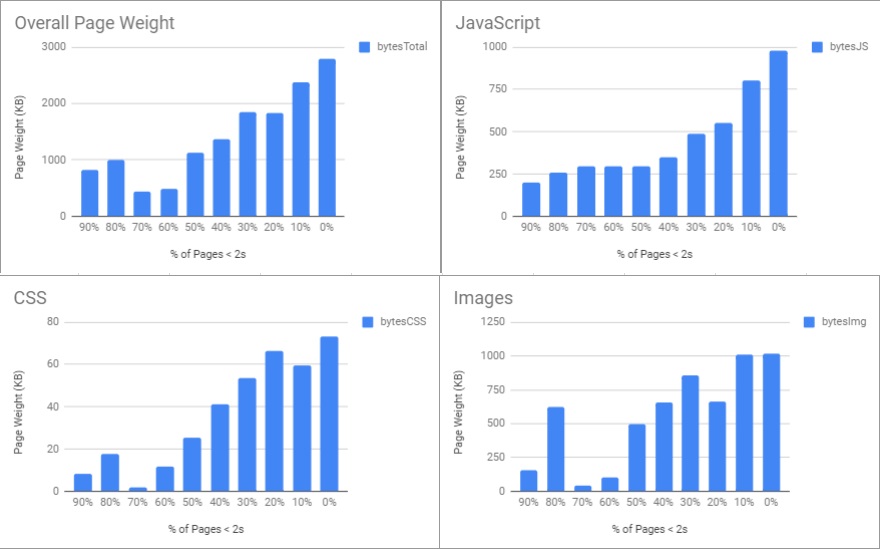
In the top left graph, page weight shows a strong correlation, and the sites with less fast pages tended to have larger page weights. The remaining 3 graphs show how JavaScript, CSS and Images contribute to page weight and performance. Based on these graphs, Images and JavaScript are the most significant contributors to the page weights that affect load time. And for some slow sites, the amount of compressed JavaScript actually exceeds the number of image bytes!
Conclusion
Page weight is an important metric to track, but we should always consider using appropriate statistical methods when tracking it on the web as a whole. Certainly track it for your sites – because as you’ve seen here, the size of content does matter. It’s not the only thing that matters – but the correlation is strong enough that a spike in page weight should merit some investigation.
If your site has a page weight problem, there are a few things you do can do:
- Akamai’s Image Manager can help to optimize images with advanced techniques such as perceptual quality compression. This is also a great way to ensure that you don’t get any surprises when a marketing promo drops an 2MB hero image on your homepage.
- Limit the use of large video files, or defer their loading to avoid critical resources competing for bandwidth. Check out Doug Sillars’ blog post on videos embedded into web pages.
- Lazy load images that are not in the viewport of your screen. Jeremy Wagner wrote a nice guide on this recently.
- Ensure that you are compressing text based content. Gzip compression at a minimum should be enabled. Brotli compression is widely supported can help reduce content size further. (Akamai Ion customers can automatically serve Brotli compressed resources via Resource Optimizer)
- Use Lighthouse and Chrome Dev Tools to audit your pages. Find unused CSS and JS with the Coverage feature and attempt to optimize.
- Audit your 3rd parties. Many sites do not realize how much content their 3rd parties add to their site and how inconsistent their performance may become as a result. Harry Roberts wrote a helpful guide here!. Also, Akamai’s Script Manager service can help to manage third parties based on performance.
- Track your sites page weight over time and alert on increases. If you use Akamai’s mPulse RUM service – you can do this with resource timing data (if TAO is permitted).
Thanks to Yoav Weiss and Ilya Grigorik for reviewing this and providing feedback.