When we talk about cacheability of web content, often times the discussion is around content that site operators have control over (ie, first party content). But what about third party content? How much of that is cacheable? I was chatting with @yoav about this on Friday, since it could be useful to understanding the benefits of signed exchanges on accelerating third party content. Is it worth delivering cross origin resources on a site’s HTTP/2 connection, avoiding the need to establish a new connection and eliminate bandwidth contention between 3rd party resources and 1st party ones? In order to answer that we need to understand how many third party resources are delivered without credentials, and therefore can be signed. We will use the resource’s public cacheability as a proxy for that, and try to understand how common such third party resources are.
Lighthouse is an amazing tool that you can use to quickly audit a web page and learn how it stacks up on performance, accessibility, best practices, PWA support and more. You can run it from ChromeDevTools, run one via WebPageTest measurement or analyze them in bulk here! For every page measured in the HTTP Archive a lighthouse audit is run, and the results are stored in the lighthouse tables.
When we talk about web performance measurement, there is a long list of metrics to choose from. As an industry we are converging on metrics that gauge user experience – such as “Time to Interactive” and “Time to Visually Ready”. Other metrics such as onLoad and First Contentful Paint are also widely used and available in most browsers via APIs such as Navigation Timing and Paint Timing. And then there are Speed Index, Start Render, Fully Loaded time and many others, including protocol times (DNS/TCP/TLS) and backend times (TTFB). You are optimizing your sites and have all these measurements at your disposal – so what do you use to evaluate your changes?
Over the past few years we’ve seen a tremendous growth in mobile traffic on the web. Because of this many of the most successful websites have invested in optimizing the experience of users on whatever device they use and however they connect to the internet. With mobile traffic now exceeding desktop, serving a quality mobile experience is more important than ever. During the recent holiday weekend, I was wondering how much retail traffic occurred via mobile or desktop devices. Was there a large shift towards mobile during peak times on Black Friday and Cyber Monday? Did mobile usage spike on specific days, or times of day? And when users are connecting from mobile, are they connecting over cellular networks or WiFi?
The HTTP Archive is an open source project that tracks how the web is built. Twice a month it crawls 1.3 million web pages on desktop and emulated mobile devices, and collects technical information about each of the web pages. That information is then aggregated and made available in curated reports. The raw data is also made available via Google BigQuery, which makes answering interesting questions about the web accessible to anyone with some knowledge of SQL as well as the curiosity to dig in.
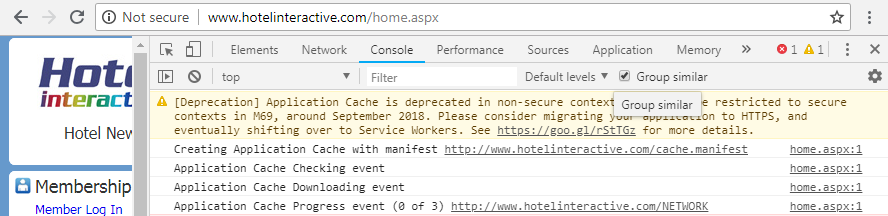
The Application Cache has been deprecated and removed from the web standards. While some browsers still support it - that support is going away. For example, starting with Firefox 44 a console warning advised developers to use Service Workers instead. In Chrome v68, when an HTTP page loads with AppCache configured, the browser provides a warning that v69 will restrict AppCache to secure context only.
Last month WebPageTest added support for Wappalyzer, which makes it super easy to uncover technologies used on websites. And now a month later the data from it is available in the HTTP Archive!
A few years ago Brotli compression entered into the webperf spotlight with impressive gains of up to 25% over gzip compression. The algorithm was created by Google, who initially introduced it as a way to compress web fonts via the woff2 format. Later in 2015 it was released as a compression library to optimize the delivery of web content. Despite Brotli being a completely different format from Gzip, it was quickly supported by most modern web browsers.
Over the years it has been fun to track website page weight by comparing it to milestones such as the size of a floppy disk (1.44MB), the size of the original install size of DOOM (2.39MB) and when it hit 3MB last summer.
During a discussion about correlating 3rd party content to performance I decided to have some fun combining both the HTTP Archive and Chome User Experience Report data sets to see what we can learn. The results were pretty conclusive that there is a strong correlation between the % of 3rd party content on a site and the load times (measured via the onLoad metric).